12 Charts That Caught Our Eye This Week
If a picture paints a thousand words, what’s the word count on an epic chart?
Like many of our readership base, we get swamped by different graphics, charts and diagrams on a daily basis. Wading through the important versus the slightly irrelevant takes time.
Although by no means a regular piece (although DM us if you do like it), as we end the work week, we wanted to share some of the best and most informative charts that have caught our eye. We’ve broken them down into rough categories to make things easier.
Don’t forget to leave a like at the end. Enjoy.
Markets
Chart 1 - Hedge fund exposure to mega-cap technology stocks just crossed 30% for the first time in history. There has never been more hedge fund exposure to large technology stocks. Institutional money really believes that AI is the next big thing…
Chart 2 - Speaking of big tech, we can’t ignore the continued move higher in Nvidia shares. Yet the move in 2023 isn’t the whole story, so consider the move since the IPO. Two stats here to note - annualised return of NVDA of 29.87% vs. Tech Select Sector ETF of 7.72%.
Chart 3 - Following Eurozone inflation data from Thursday that showed it has stopped slowing, heightened chatter is now being had over whether it’s time to throw in the towel on long EUR trades and get short. Given the concerns over stagflation, year-end forecasts are starting to get revised lower by BofA and JPM…
Chart 4 - You might be fed up with the debate as to whether the US will go into a recession within the next 12 months, so you might consider thinking instead about which asset might be worth buying if we do get one. In the below case, keeping it simple (i.e. buy gold) is the best play.
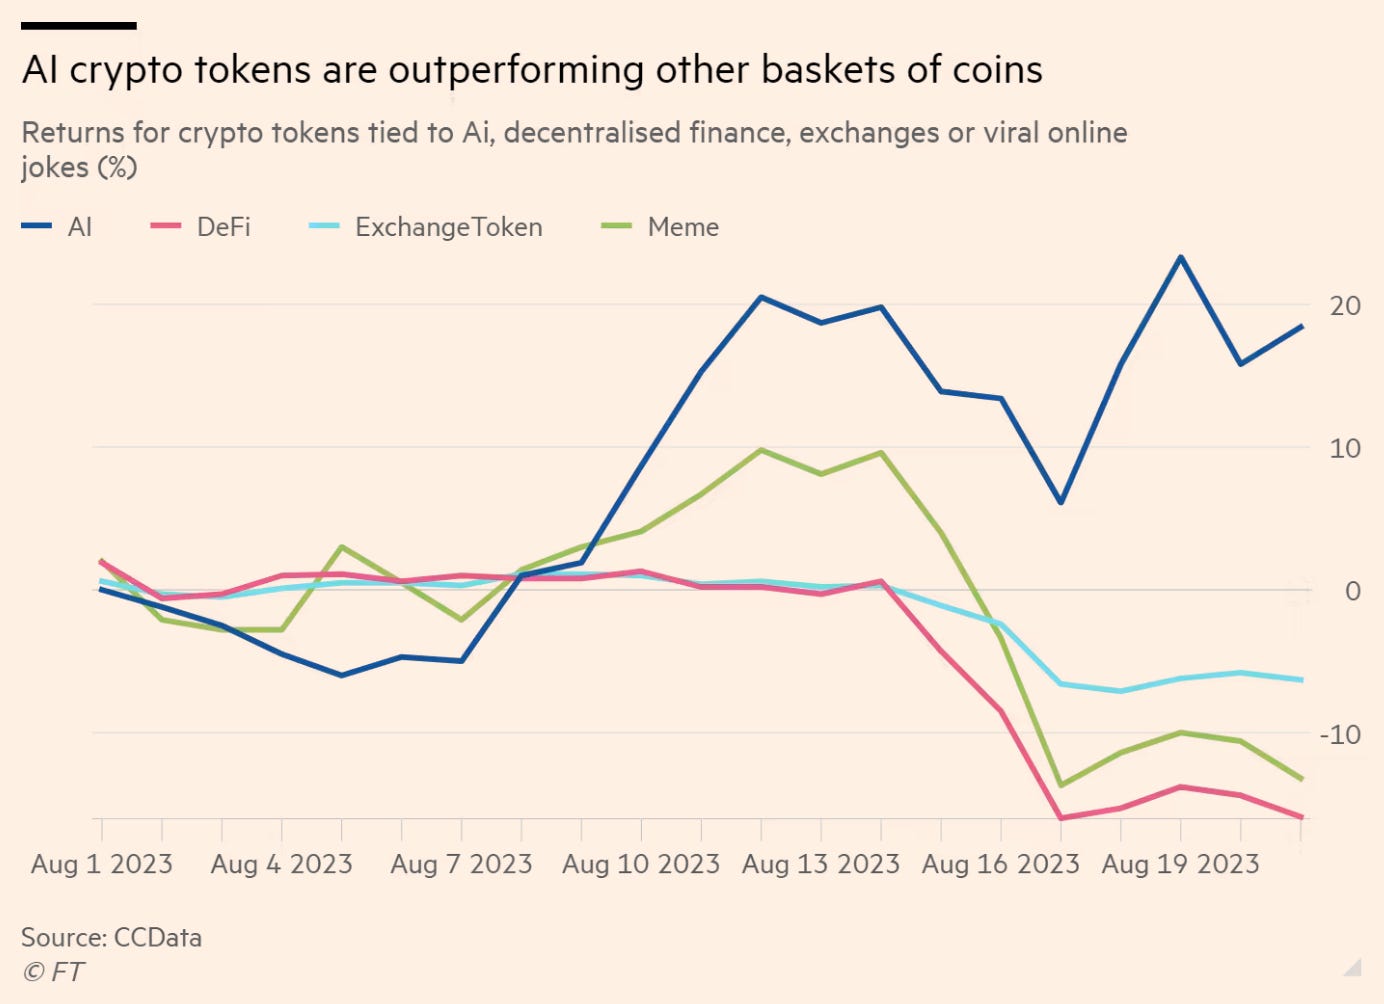
Chart 5 - Label anything “AI” and it will generate interest, it seems. In the world of alternative crypto tokens that are not Bitcoin or ether, coins that are linked with AI projects are the only basket of cryptocurrencies delivering positive returns so far this month.
Other baskets, including exchange tokens and decentralised finance tokens, are trending firmly in the wrong direction. This, of course, is not very surprising considering the total value locked in decentralised finance projects has dipped below $40bn, a far cry from its almost $180bn height in late 2021.
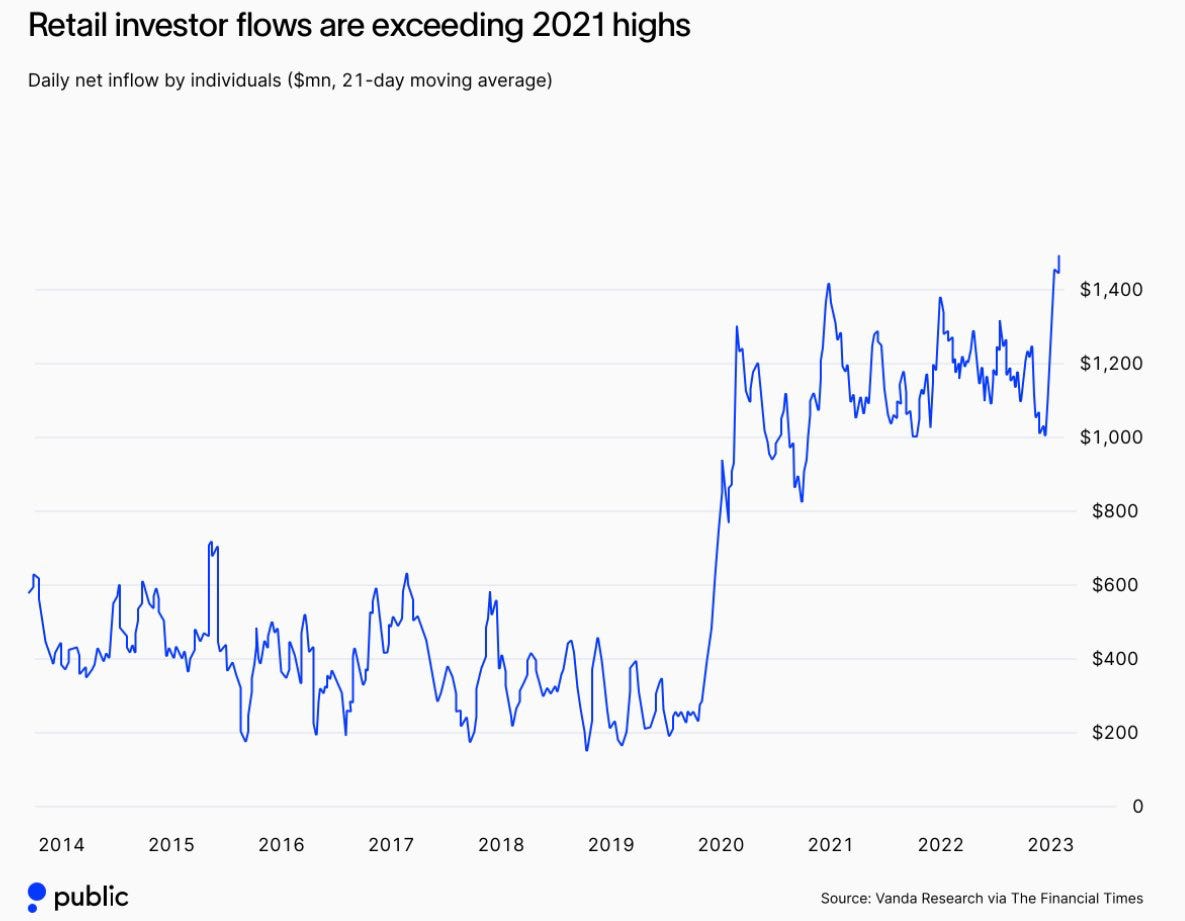
Chart 6 - Retail investors are going all in. Inflows have not been this high since the start of 2021. But as we have seen from chart 1, hedge funds seem to be on the side of the little one. Chart shared by David Marlin
Economics
Chart 7 - A clear depiction below of how sensitive the market is right now to data from the US. After disappointing JOLTS job data on the 29th, the pink line reflects the added cuts being priced in over the course of the next year and beyond.
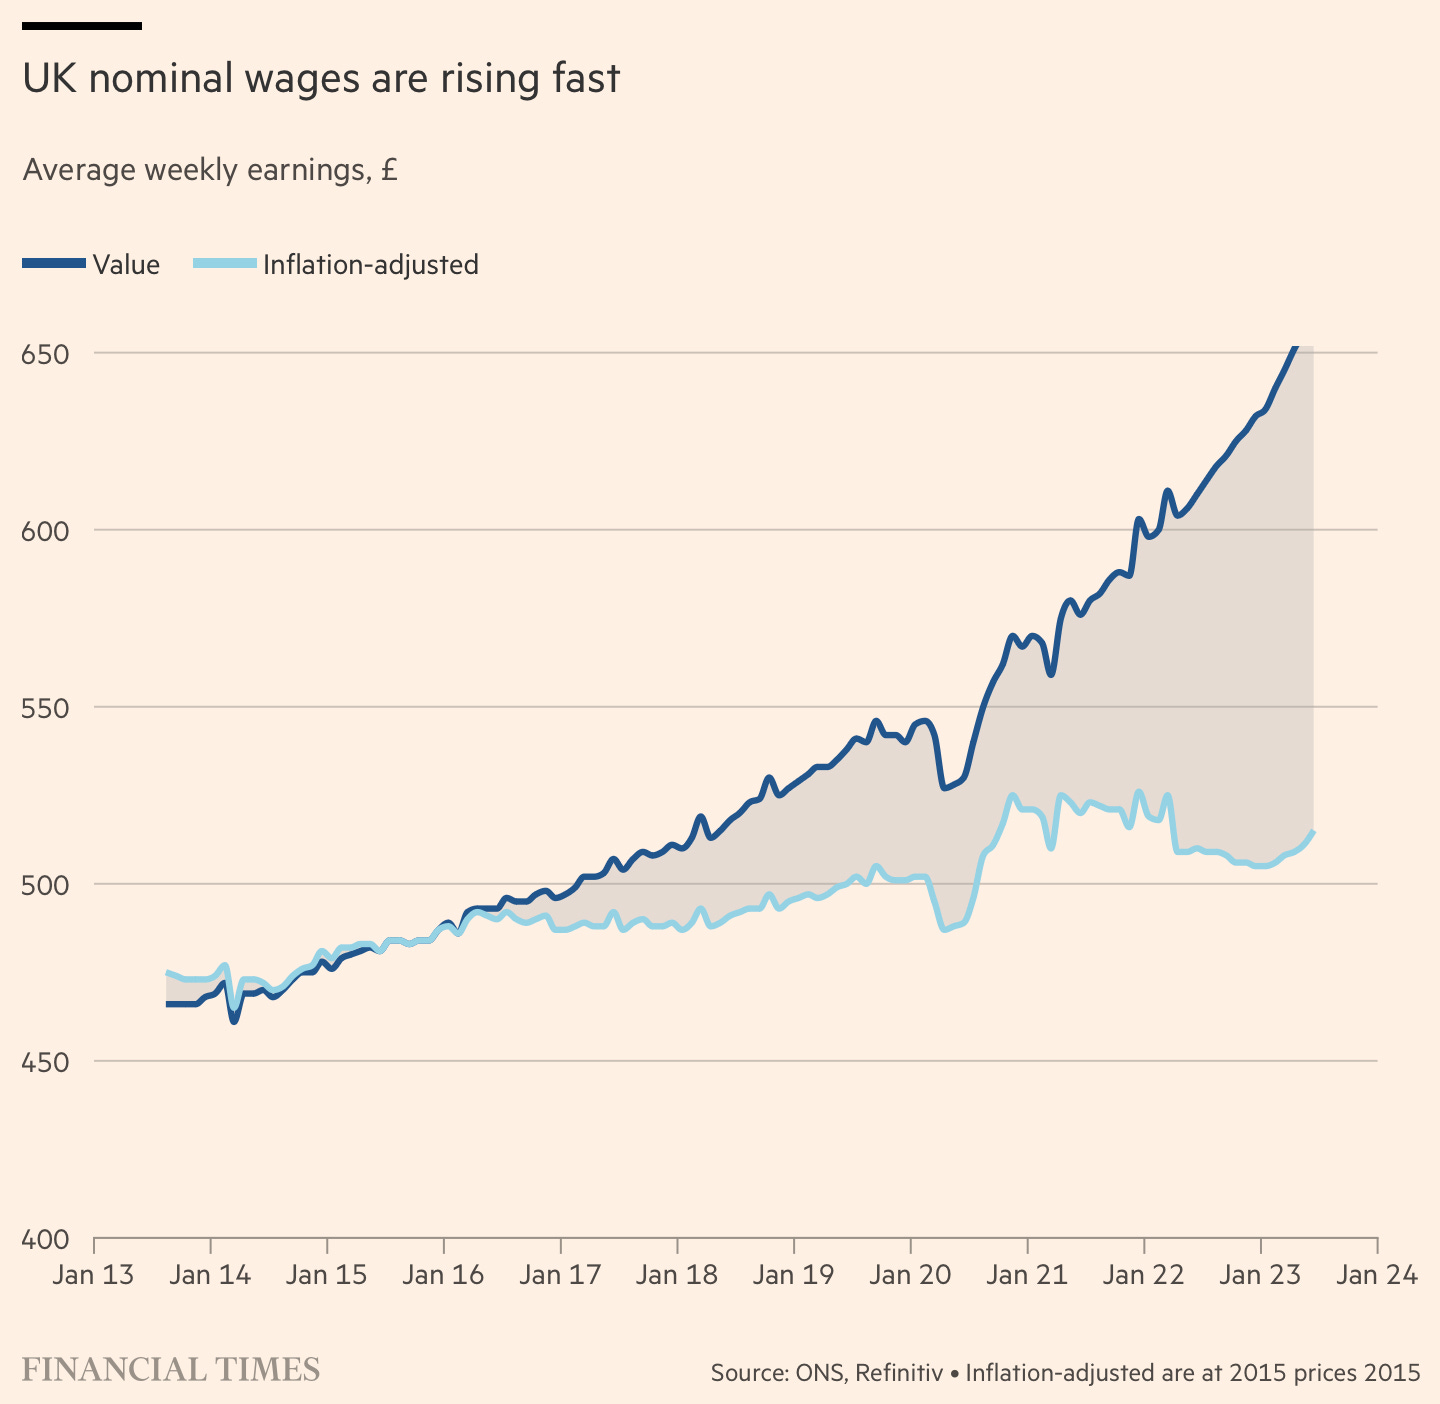
Chart 8 - “The trend is clearly visible in UK wages, which rose at the fastest pace on record in the three months to June, and high job-to-job moves — reflecting workers trying to limit the hit to their finances coming from high inflation and rising rates. In cash terms, total wages are up 21 per cent from the three months to February 2020, but when adjusted for inflation, they are largely unchanged.” - FT
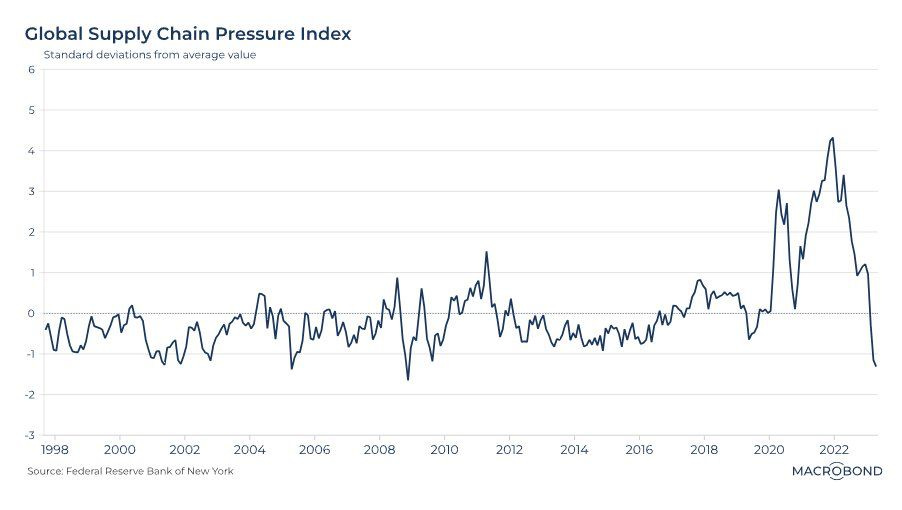
Chart 9 - After hitting a 25-year high at the end of 2021, the Global Supply Chain Pressures Index has since fallen to a near-record low. In fact, there have only been 2 months since 1998 where supply-chain pressures have been as low as they are now.
Business
Chart 10 - Our friends over at Daily Chartbook included the below in their piece earlier in the week. It goes to show that interest cover (EBIT / Interest expense) is still more than comfortable for the top S&P constituents, even with elevated interest rates.
Chart 11 - The new (6 months) Shell CEO has quietly dropped the world’s biggest corporate plan to develop carbon offsets, the environmental projects designed to counteract the warming effects of CO2 emissions. This raises the question of how the business will ever reach net zero by 2050.
Non-finance, but relevant
Chart 12 - The hype around AI stocks is well documented, but the below graphic really puts things into perspective with regard to the capabilities of AI relative to humans, both in the past and what could be impacted in the future.
We’ve made this post free for all - but most of our posts (including our popular trade ideas on Monday, example below) are for paid subs only. The monthly cost is simply the price of a NY or London coffee.
Two of our swing equity ideas already hit profit this week:
Netflix: $416.00 > $432.32
Tesla: $239.00 > $255.00 (contracts went over 600%)
In FX, our EUR/JPY long hit profit 158.00 > 159.50
AlphaPicks on Wall Street is a reader-supported publication. To receive new posts and support our work, consider becoming a free or paid subscriber below:


Always love some standout charts 📊