

25 Charts For '25
Themes for next year, visualised.
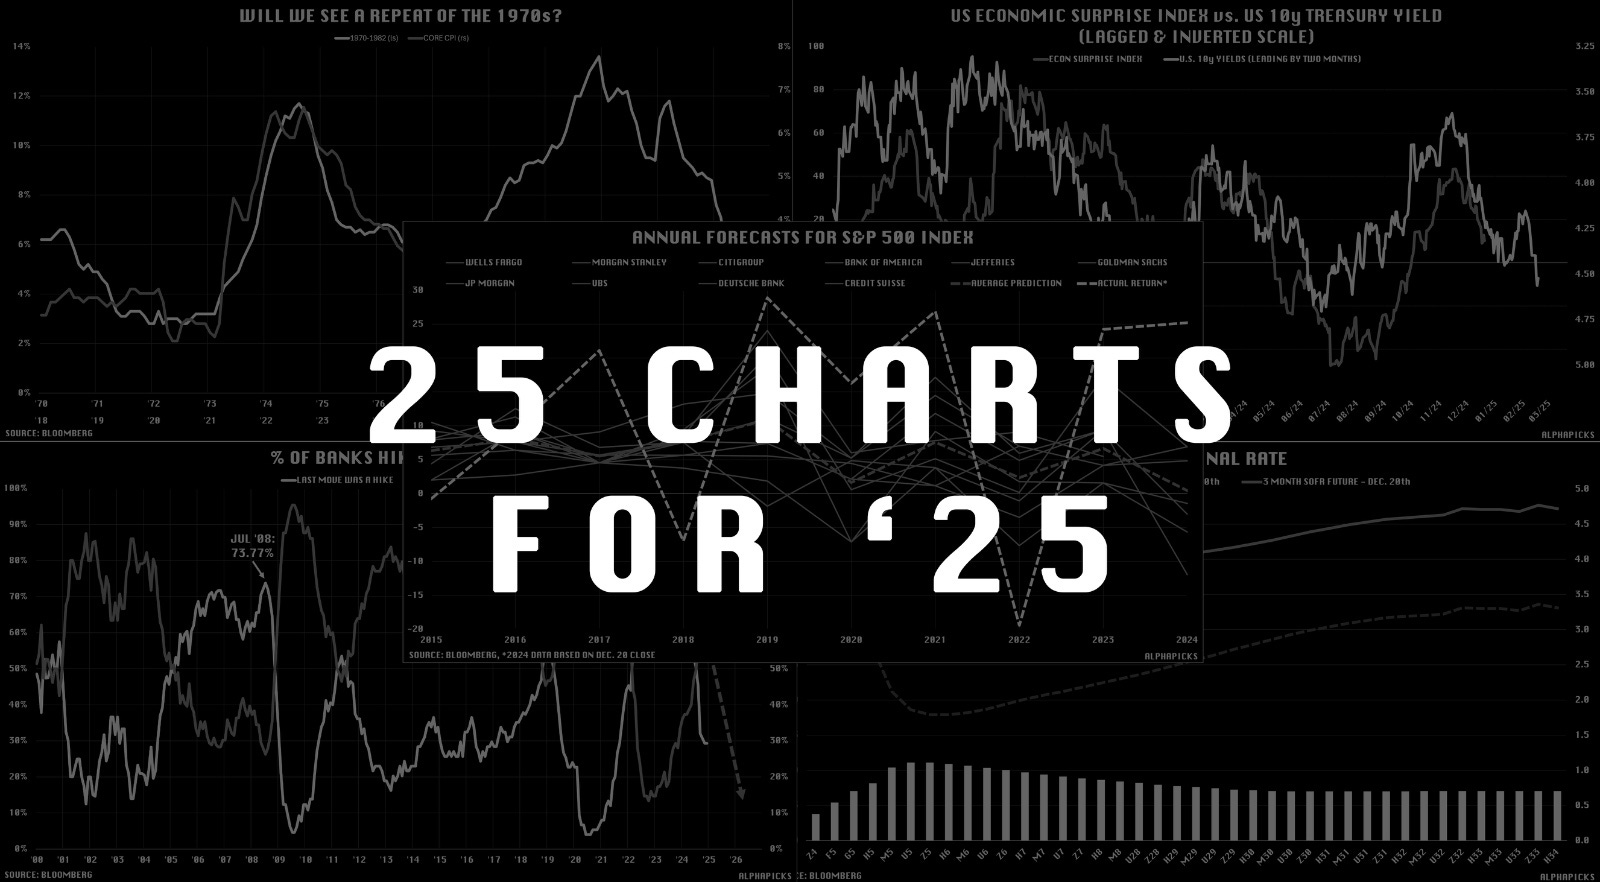
A picture can paint a thousand words. A bespoke financial chart can do even more. When looking at the year ahead, there are plenty of key themes, tail risks, notable red flags, opportunities, etc, to consider. Yet we imagine our readers are already bored reading the major bank outlook reports. So instead, we thought we’d portray some of the year ahead points via charts.
2025 Thoughts
Pay attention to 2025 predictions, but don’t take them as gospel…

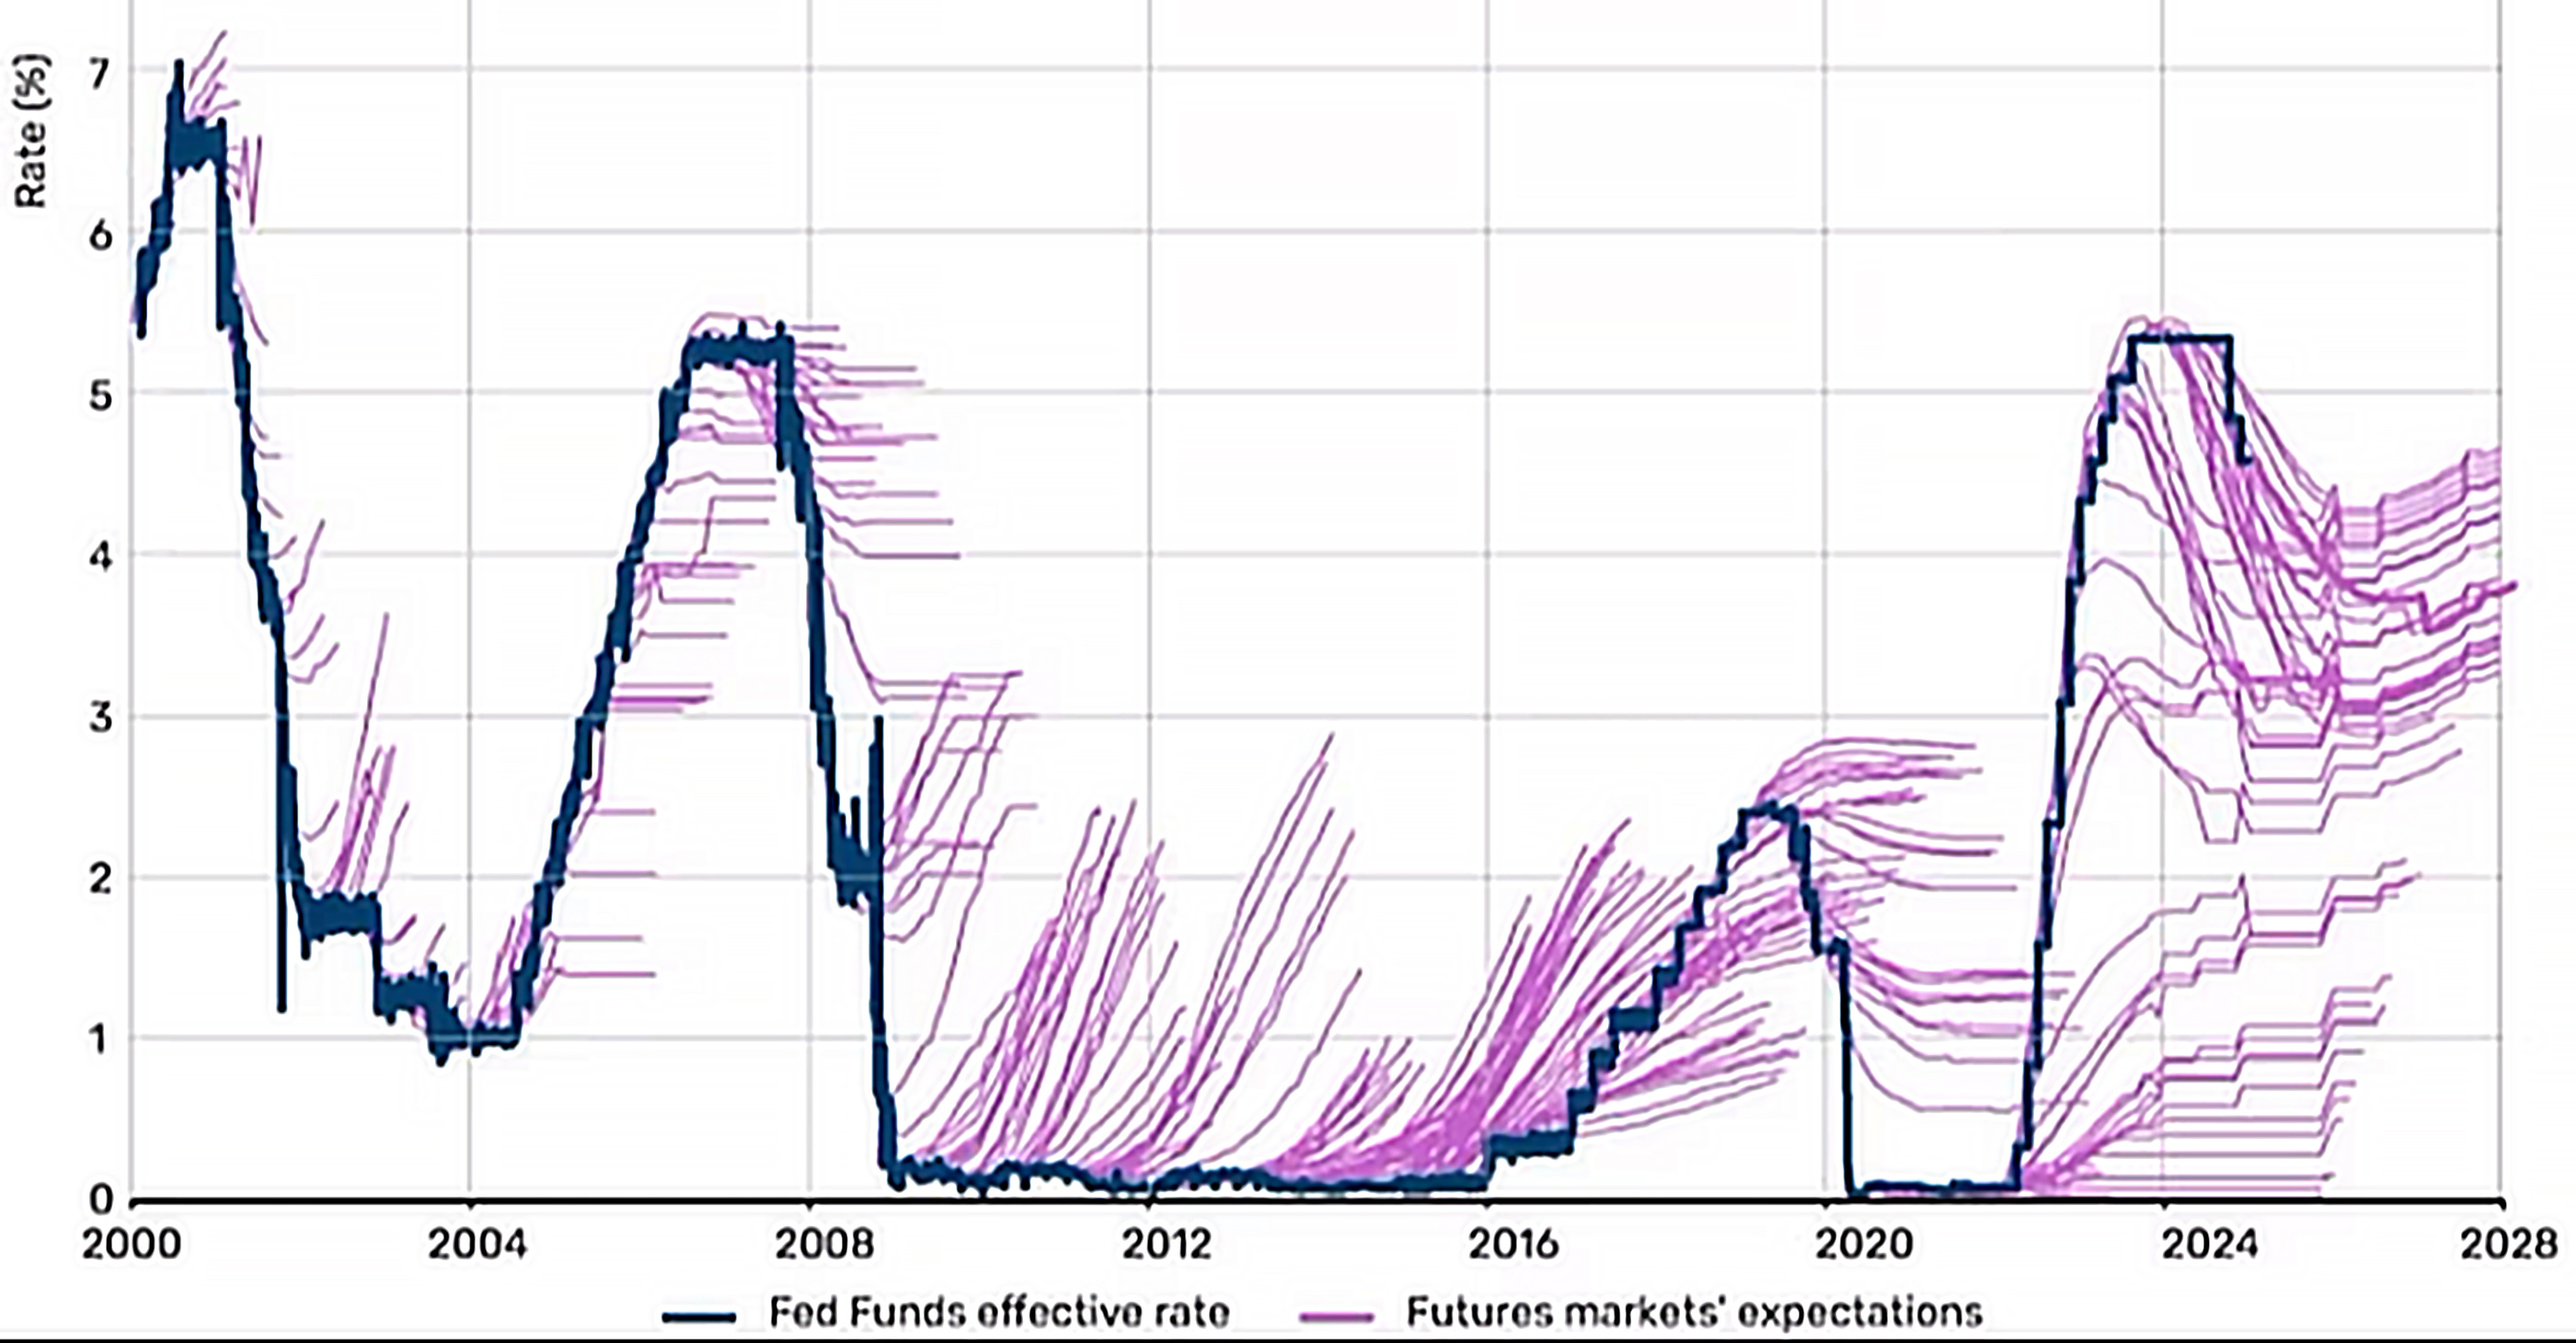
The Fed managed to out-hawk the markets in the final FOMC meeting of the year, with futures pricing for 2025 cuts becoming a lot shallower. Yet expectations of trying to predict the Fed has rarely been accurate.
Before we split off into broader macro and specific asset classes, below is our favourite visual to capture the performance across the board for this year versus previous years. Top % performers are at the top, worst at the bottom, with the asset class having the same colour throughout history.

Macro
Trump’s trade policy will be a key theme for next year. When looking at APAC as a region, China is the obvious target. Yet where else should Trump be targeting in Asia next year besides China? Well, if you frame it from the angle of who has a large US bilateral trade deficit, Vietnam and Japan should watch out.

US inflation will also be a key driver in the new year, with some flagging up the potential for a re-run of the 1970s of an initial period of high inflation, which was partially quashed before spiking again in the late 70s. Different driving dynamics, though, come as the usual disclaimer when looking for any correlation/causation charting with the past.

An influence on inflation will undoubtedly be Fed policy, but at a global level, we’re likely to be in another year of central bank easing. Although this can be flagged as inflationary, it should be able to help stimulate growth.

One central bank that can’t decide whether it wants to boost growth or focus on curbing wage pressures is Japan. Yet, with inflation now at similar levels to the US and EU (that are easing monetary policy), Japan will enter the year with the central bank looking to hike.
Debt ceiling headaches are a short-term theme to carry over into January, but whether the fiscal problems remain a story for 2025 remains to be seen. One thing is for sure, the net interest payments are starting to add up (even with the GDP growth and yields relatively stable).

Real bond yields were close to 2% in late 2024, compared to around zero when Trump first took office in 2017. Meanwhile, the debt-to-GDP ratio stood at 123%, up from 105% in 2016. Fiscal blowouts to come?

Since the FOMC filed their economic projections in September, market pricing for real terminal policy rates has risen roughly 110bps higher. SOFR (yield) curve has shifted towards 4% terminal. The debate as to where the neutral rate is (r*) will be a big theme next year.

The sudden interest in the Sahm Rule (remember that fateful ‘was it triggered’ day?) could prove to be important next year, as future employment data could prove the rule to be a reliable pre-cursor to a recession:

Equities
First, let’s touch on the US Government shutdown in case we see a reoccurrence of the December 2018 situation whereby the shutdown lasted almost all of January 2019. The S&P 500 did fall in the immediate aftermath of the news but then proceeded to rally into the new year. Takeaway? Any confirmation may cause a knee-jerk move lower, but it’s unlikely to cause material weakness.

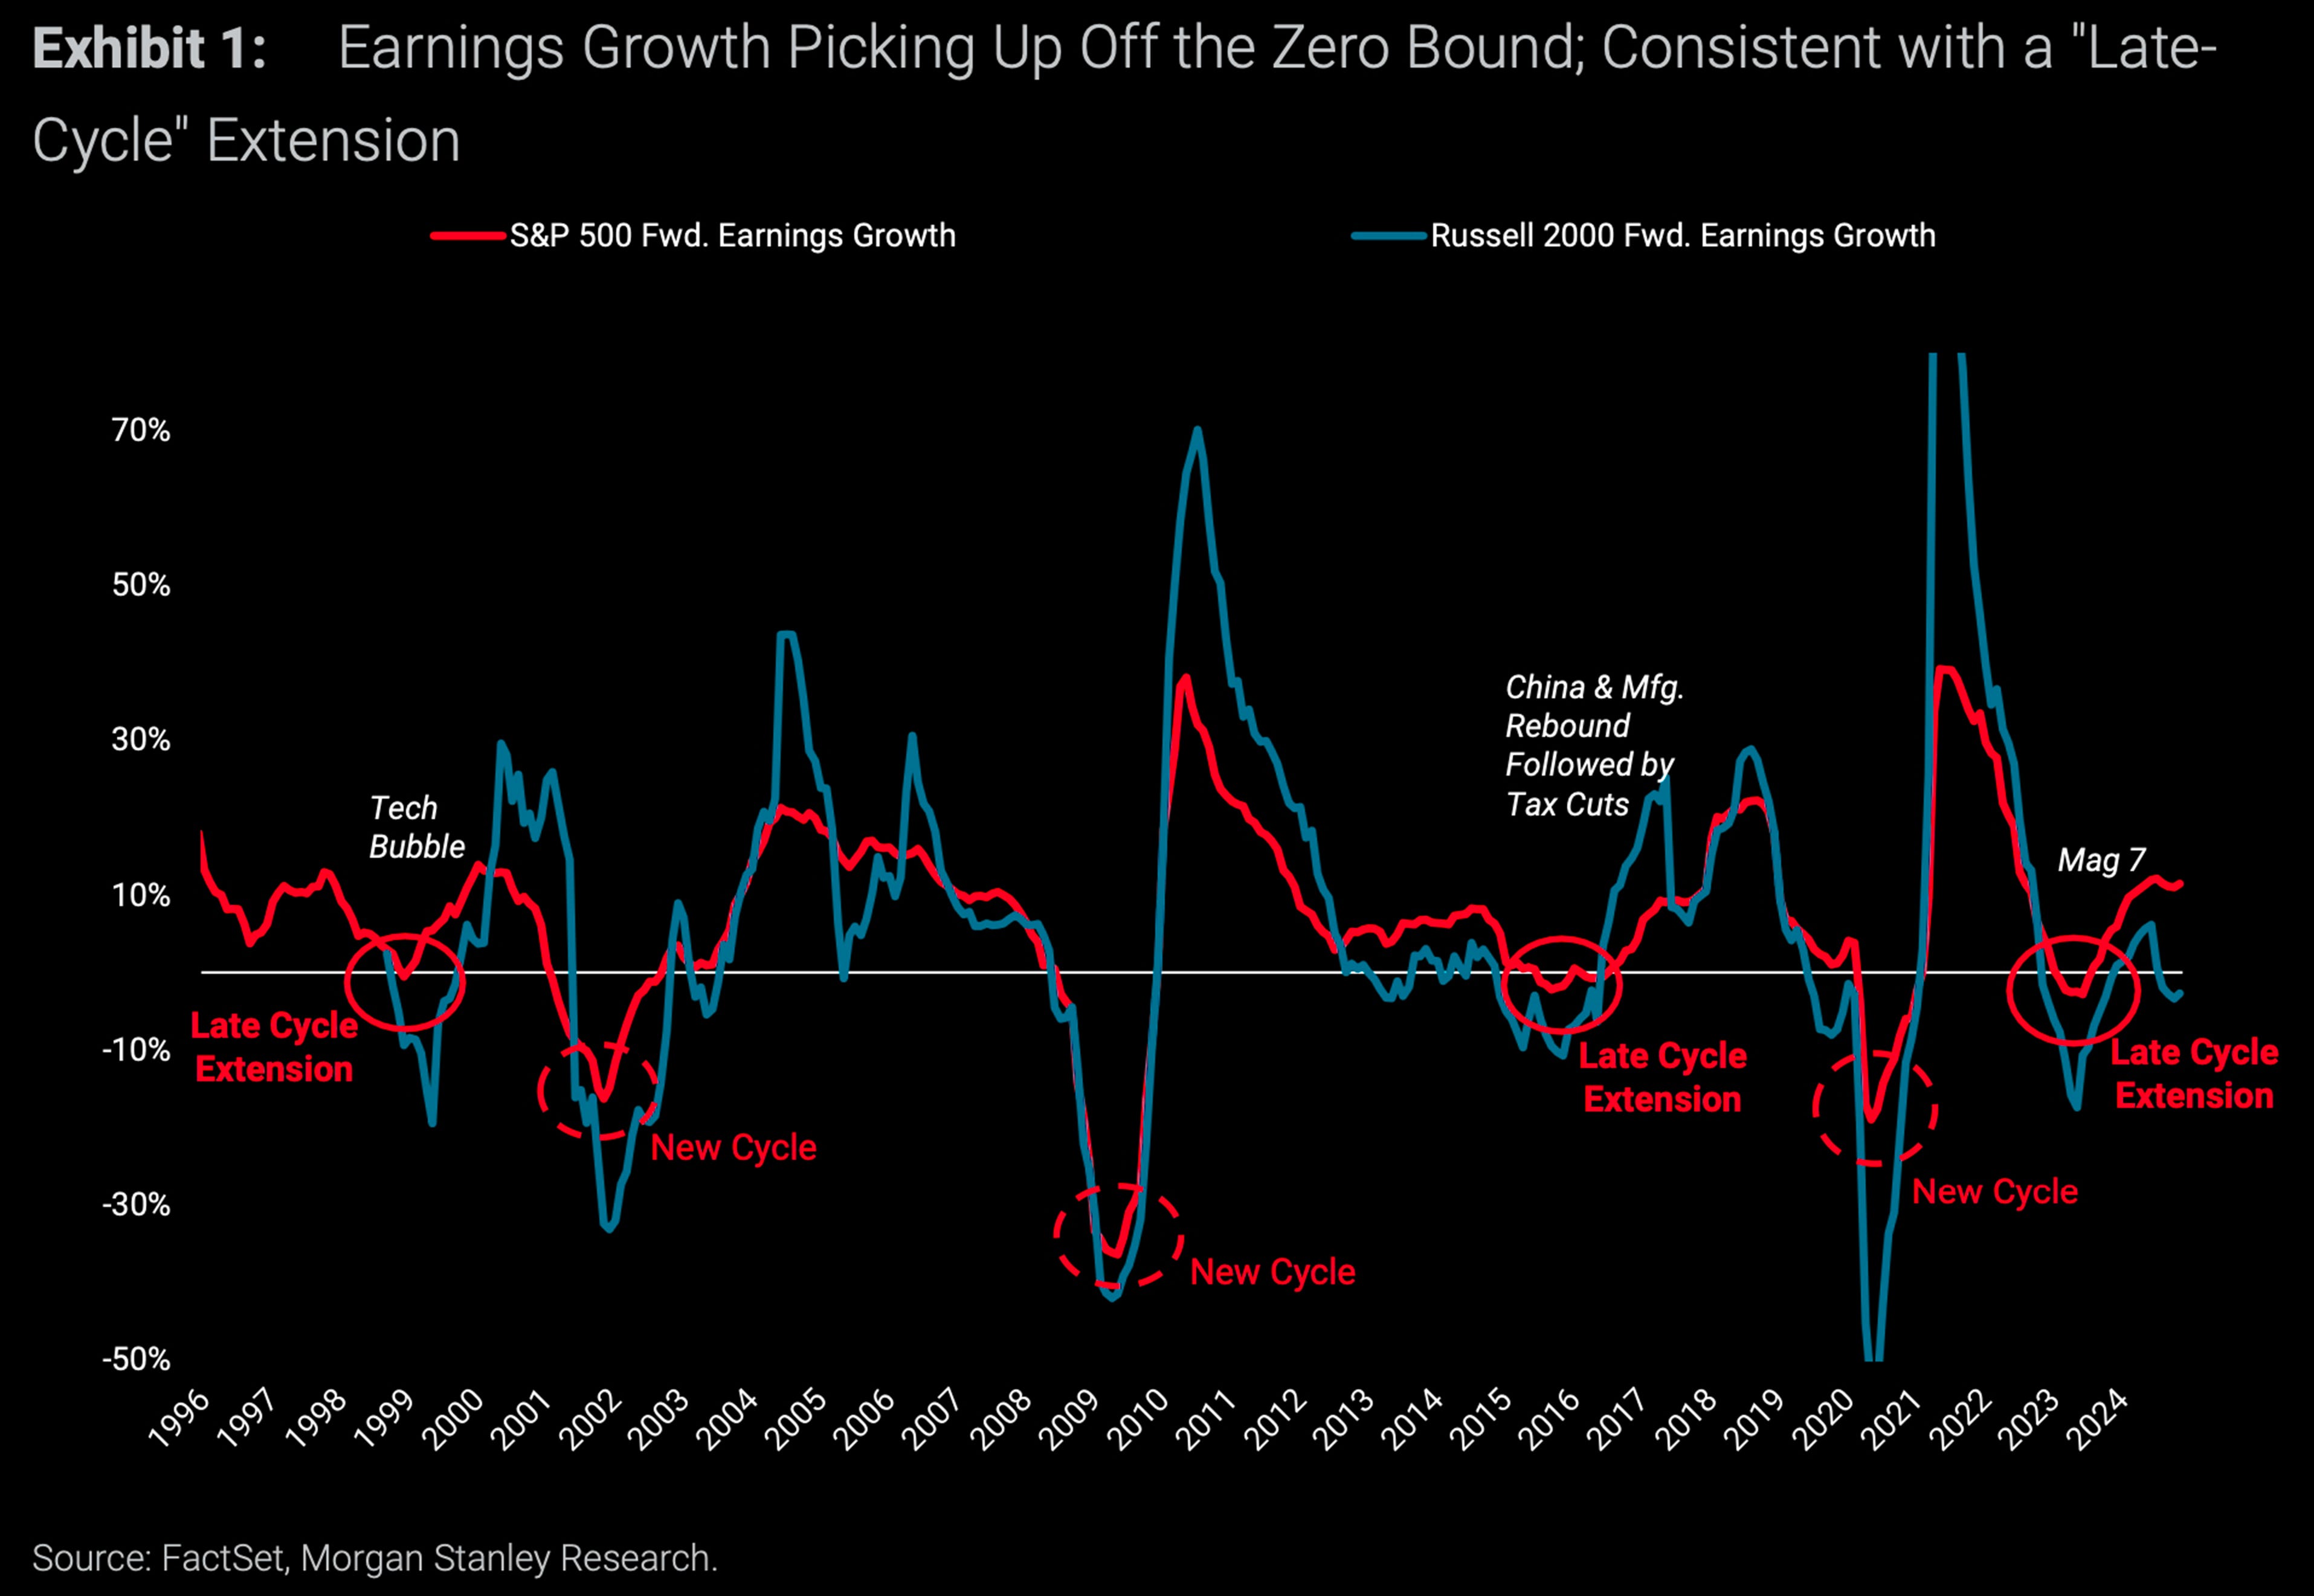
The cadence of earnings growth offers an insightful perspective on where we are in the business cycle. S&P 500 EPS growth tends to make a durable trough at ~0% or at -15-25% (small caps tend to form troughs/peaks of greater magnitude). The key differentiating factor determining the outcome is whether a labour cycle hits the economy (dotted circles) or not (solid circles).
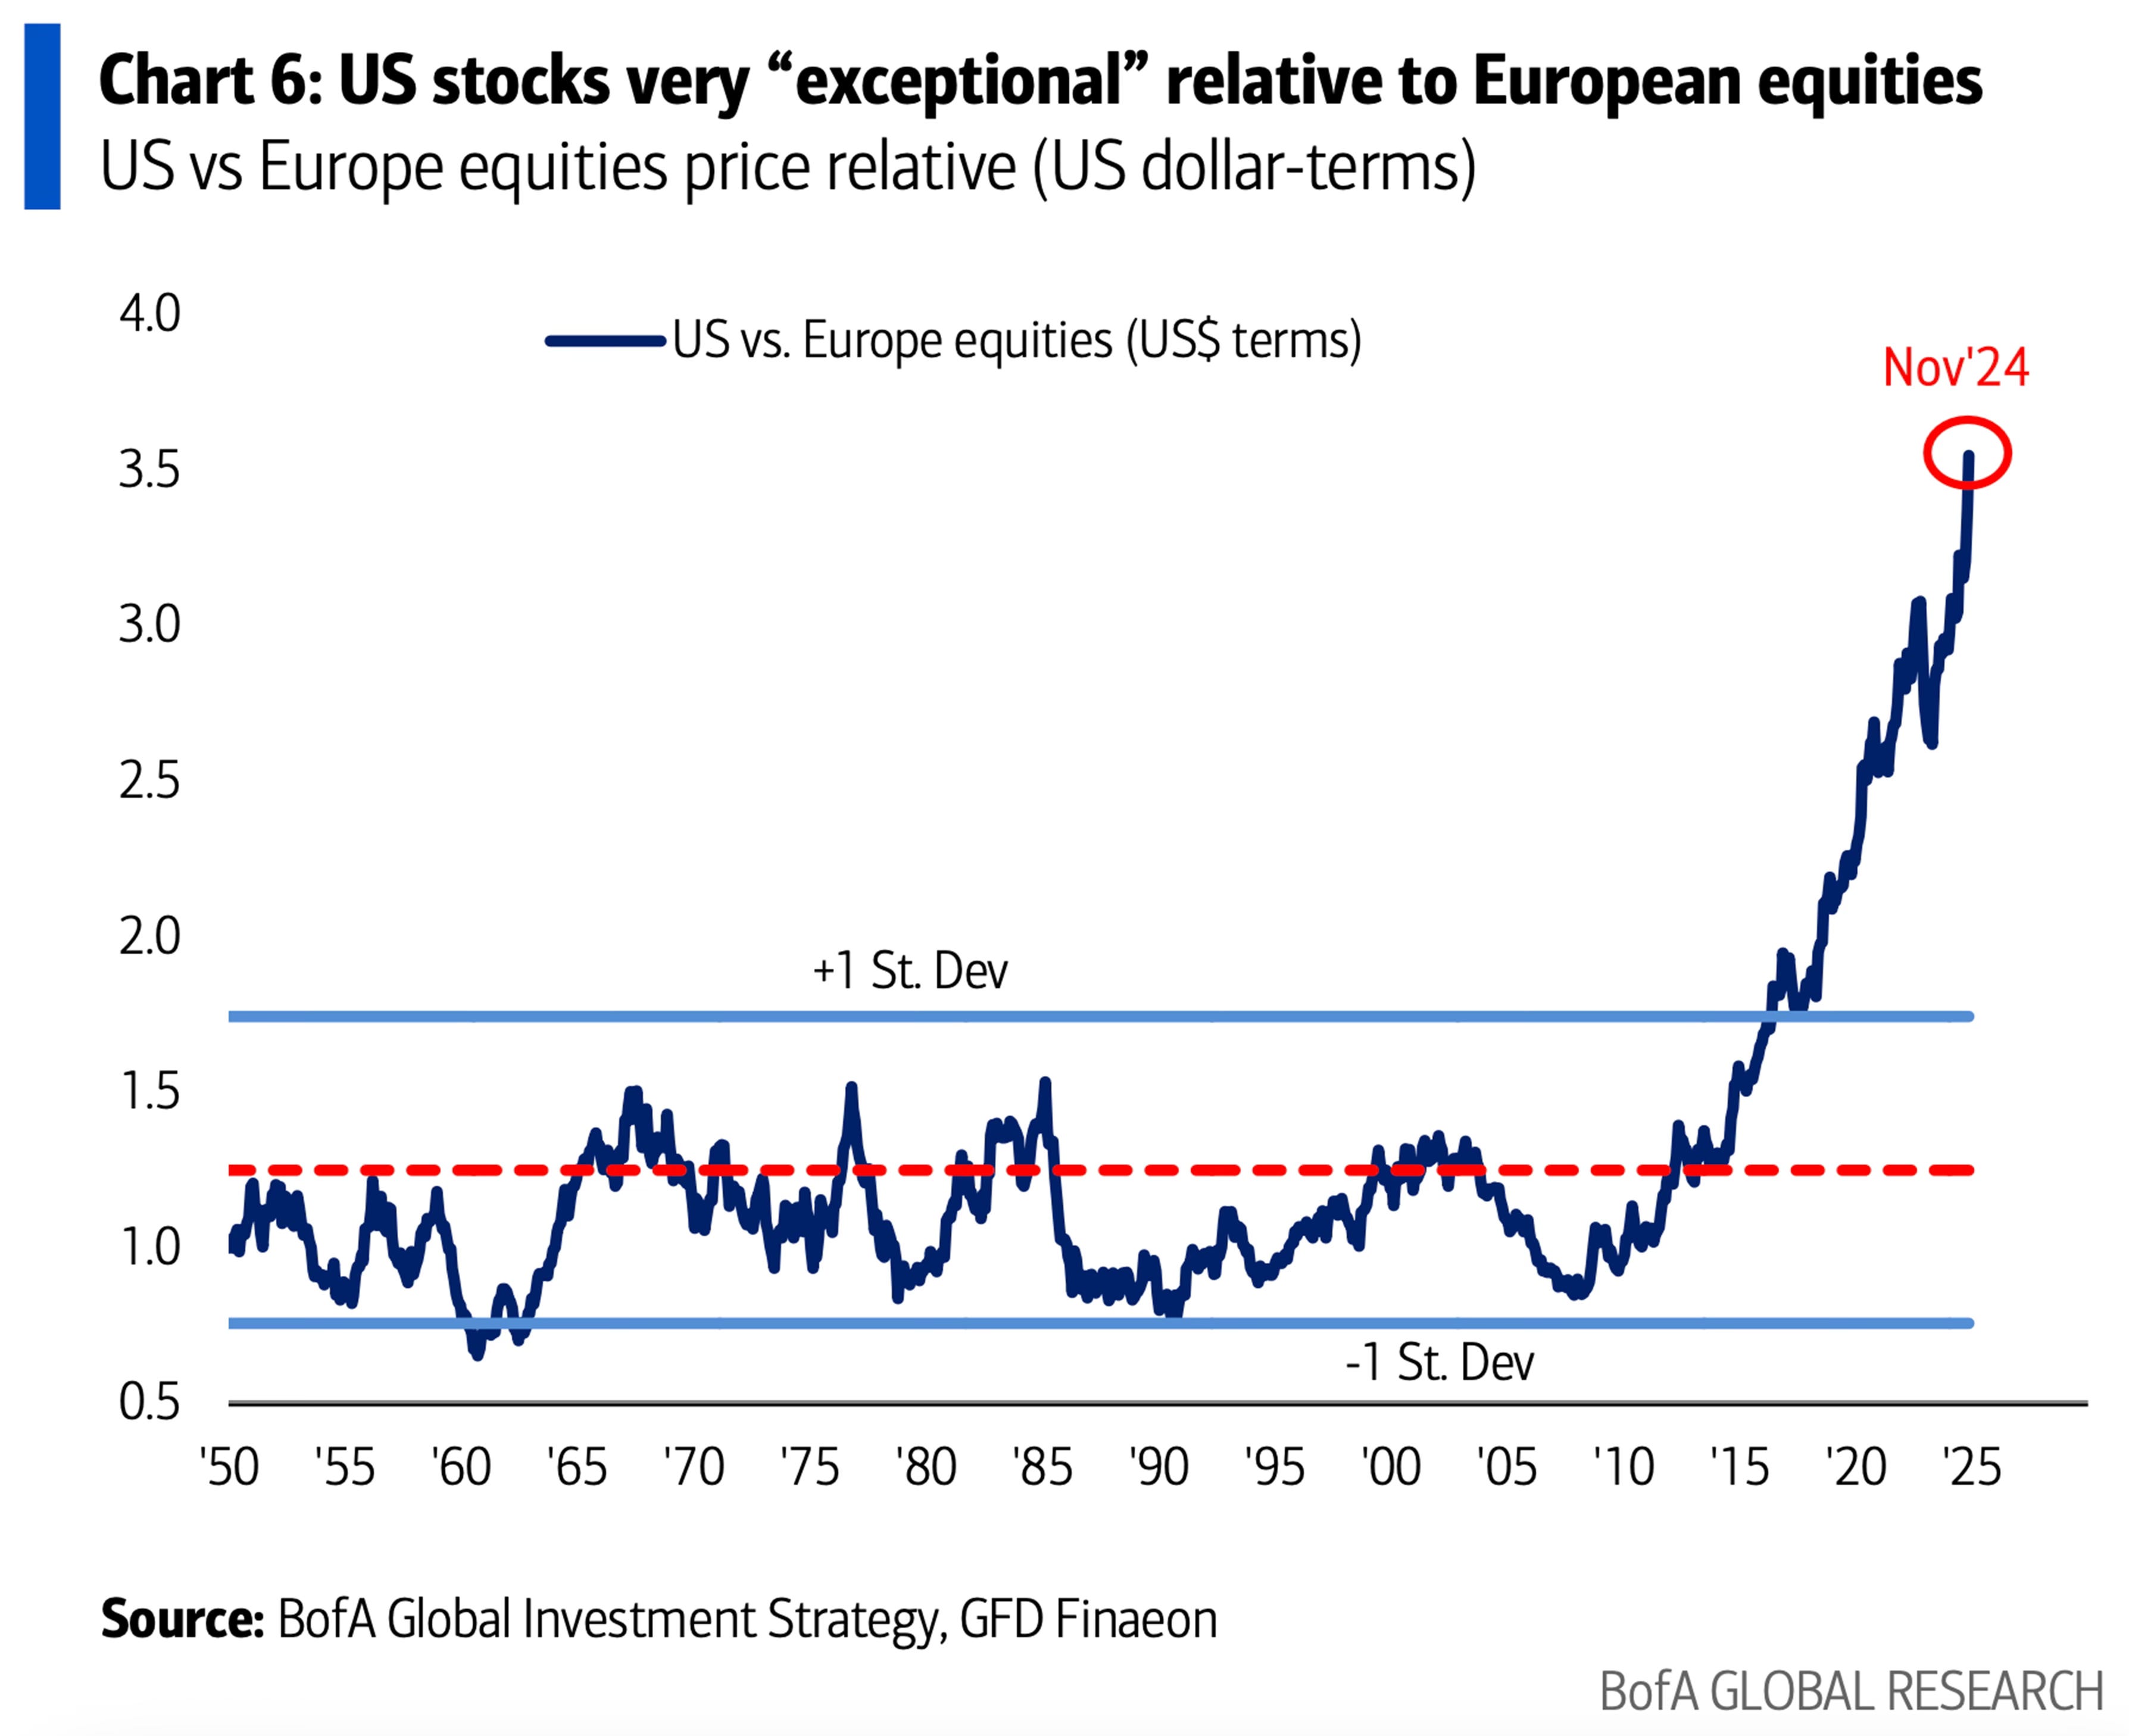
One of our favourite charts that has been shared around over the past couple of weeks (which is still very valid), is the relative value of EU stocks vs US. We’re not calling for a mean reversion in 2025, but some profit-taking from US large caps into EU names that don’t have similar US profiles isn’t a crazy play.
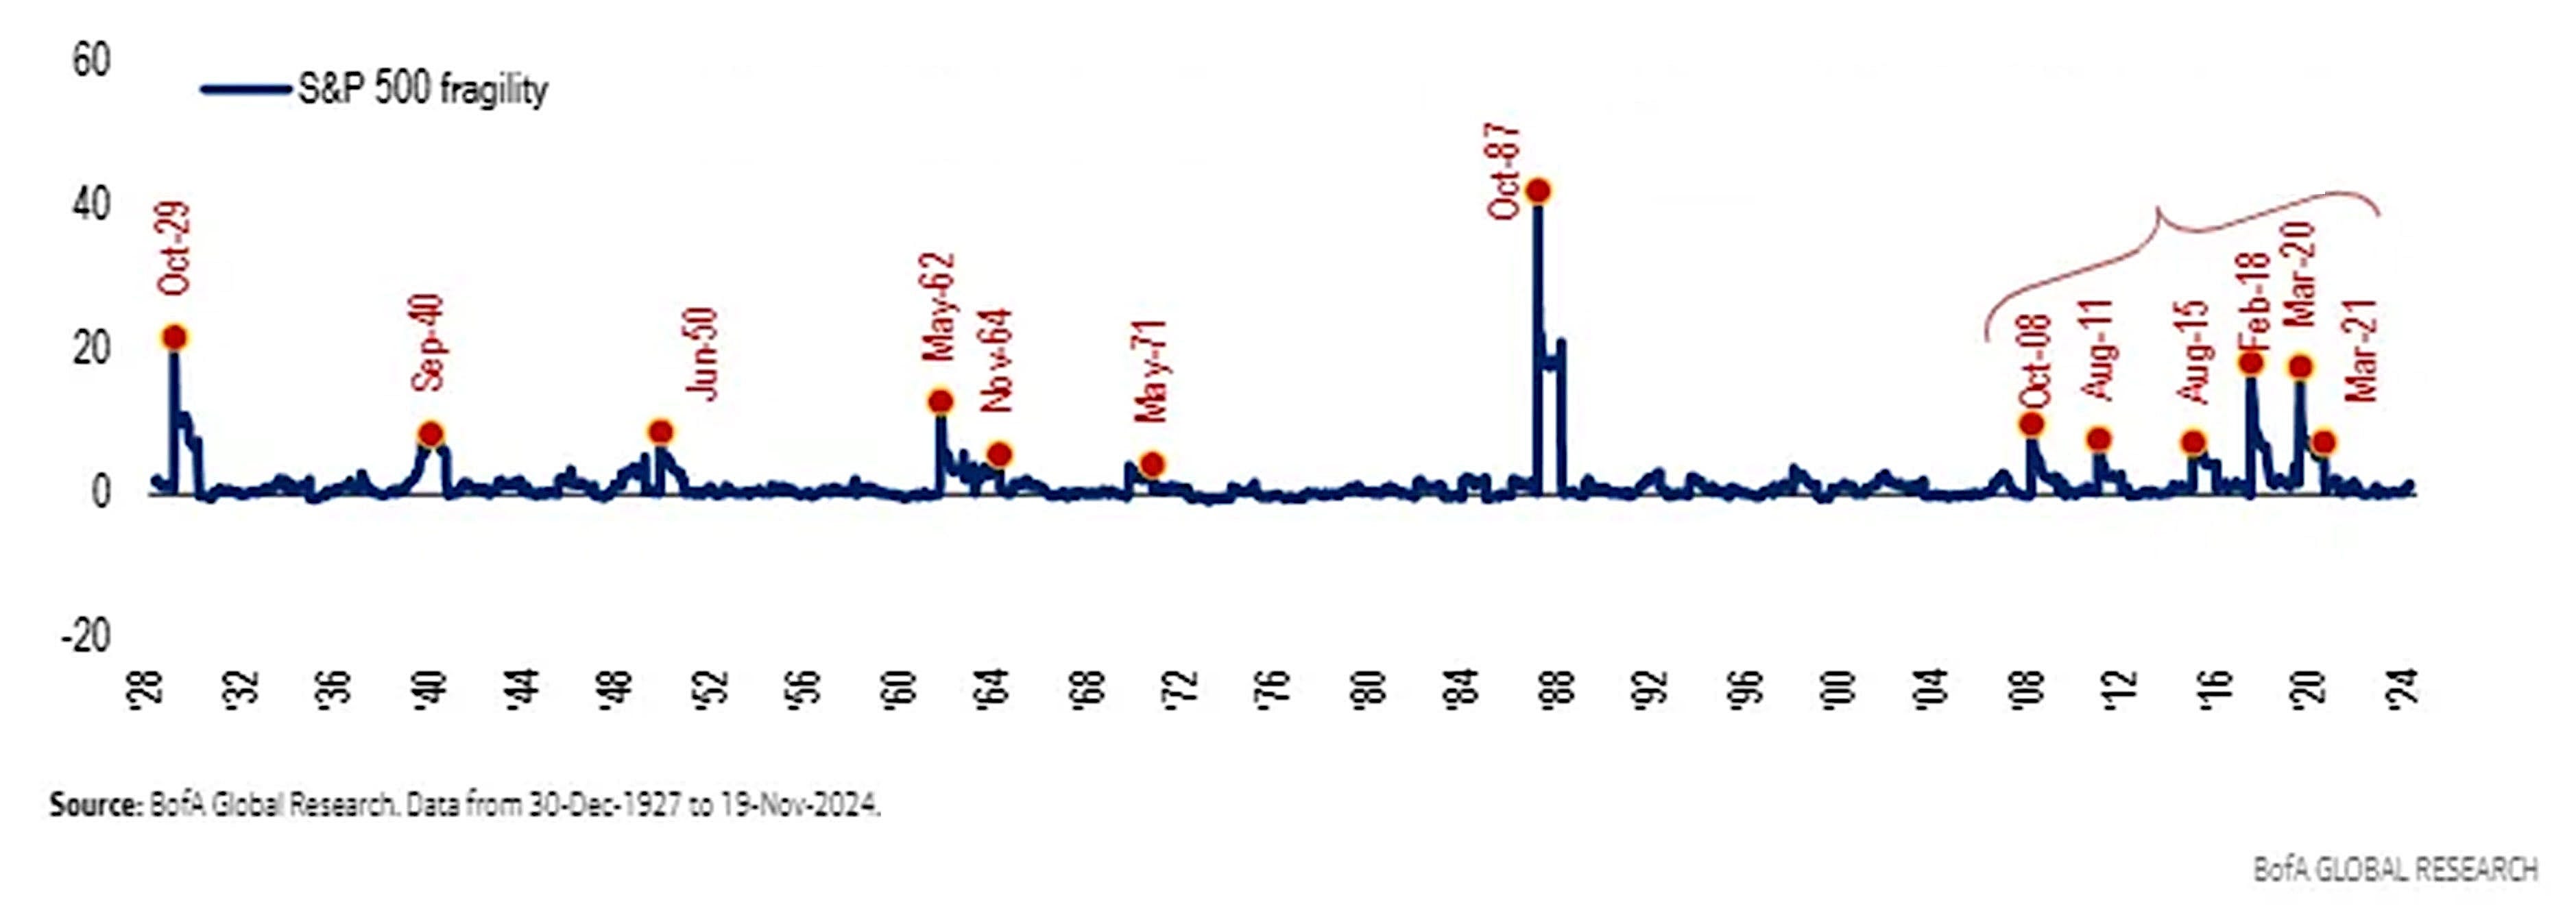
BofA expects the frequency of fragility shocks in the S&P 500 Index to increase fivefold compared with the prior 80 years and says another index-wide major shock event may be overdue.
FX
The main gauge for FX volatility (CVIX) is off the baseline six lows and has been trending higher for much of H2 2024. This is something to watch for H1 2025, where even if you feel the new administration won’t weaponise the US Dollar, it will still be very reactive to policy decisions.
In particular, 2025 promises to be a big year for EUR/USD, with 1yr ATM vol jumping in the past month. This combines not only the USD leg we referenced above but also a Eurozone dealing with political issues in France and Germany, combined with a reactive ECB. Little surprise, demand for hedging is high.

Aside from EUR/USD being the focal point of most G10 FX traders to end the year, spot volume in USD/JPY has also picked up. With the BoJ sitting on their hands for the past three meetings, January and the rest of Q1 provide extensive two-way risks for Yen speculators.

Talking about the Yen, 2024 saw another bout of intervention from the Ministry of Finance in order to stem weakness in the currency. The MoF flag up the scale and speed of any FX move as being the main trigger for potential intervention, not a specific price level. History shows us that in the case of any intervention, short-term Yen strength can still fade in the long term.

Bonds
When isolating Fed Funds Futures pricing for 2025 (shown below via the Fed Funds spread between the Dec 24 and Dec 25 contracts), we can see that the market heads into the new year looking for 62bps worth of cuts. This materially changed from over 100bps priced back in September and is now tracking closer to the latest Fed dot plots.

Bond yields have surged since mid-September, with the 10-year yield rising from about 3.6% to 4.4%. This sharp increase is expected to dampen economic momentum in the coming months despite the Fed easing. Historically, there has been an inverse relationship between the U.S. Economic Surprise Index and the 10-year Treasury bond yields. The surprise index has fallen from +45 to +10, and if current trends continue, it could drop to around -10 by March.

Commodities
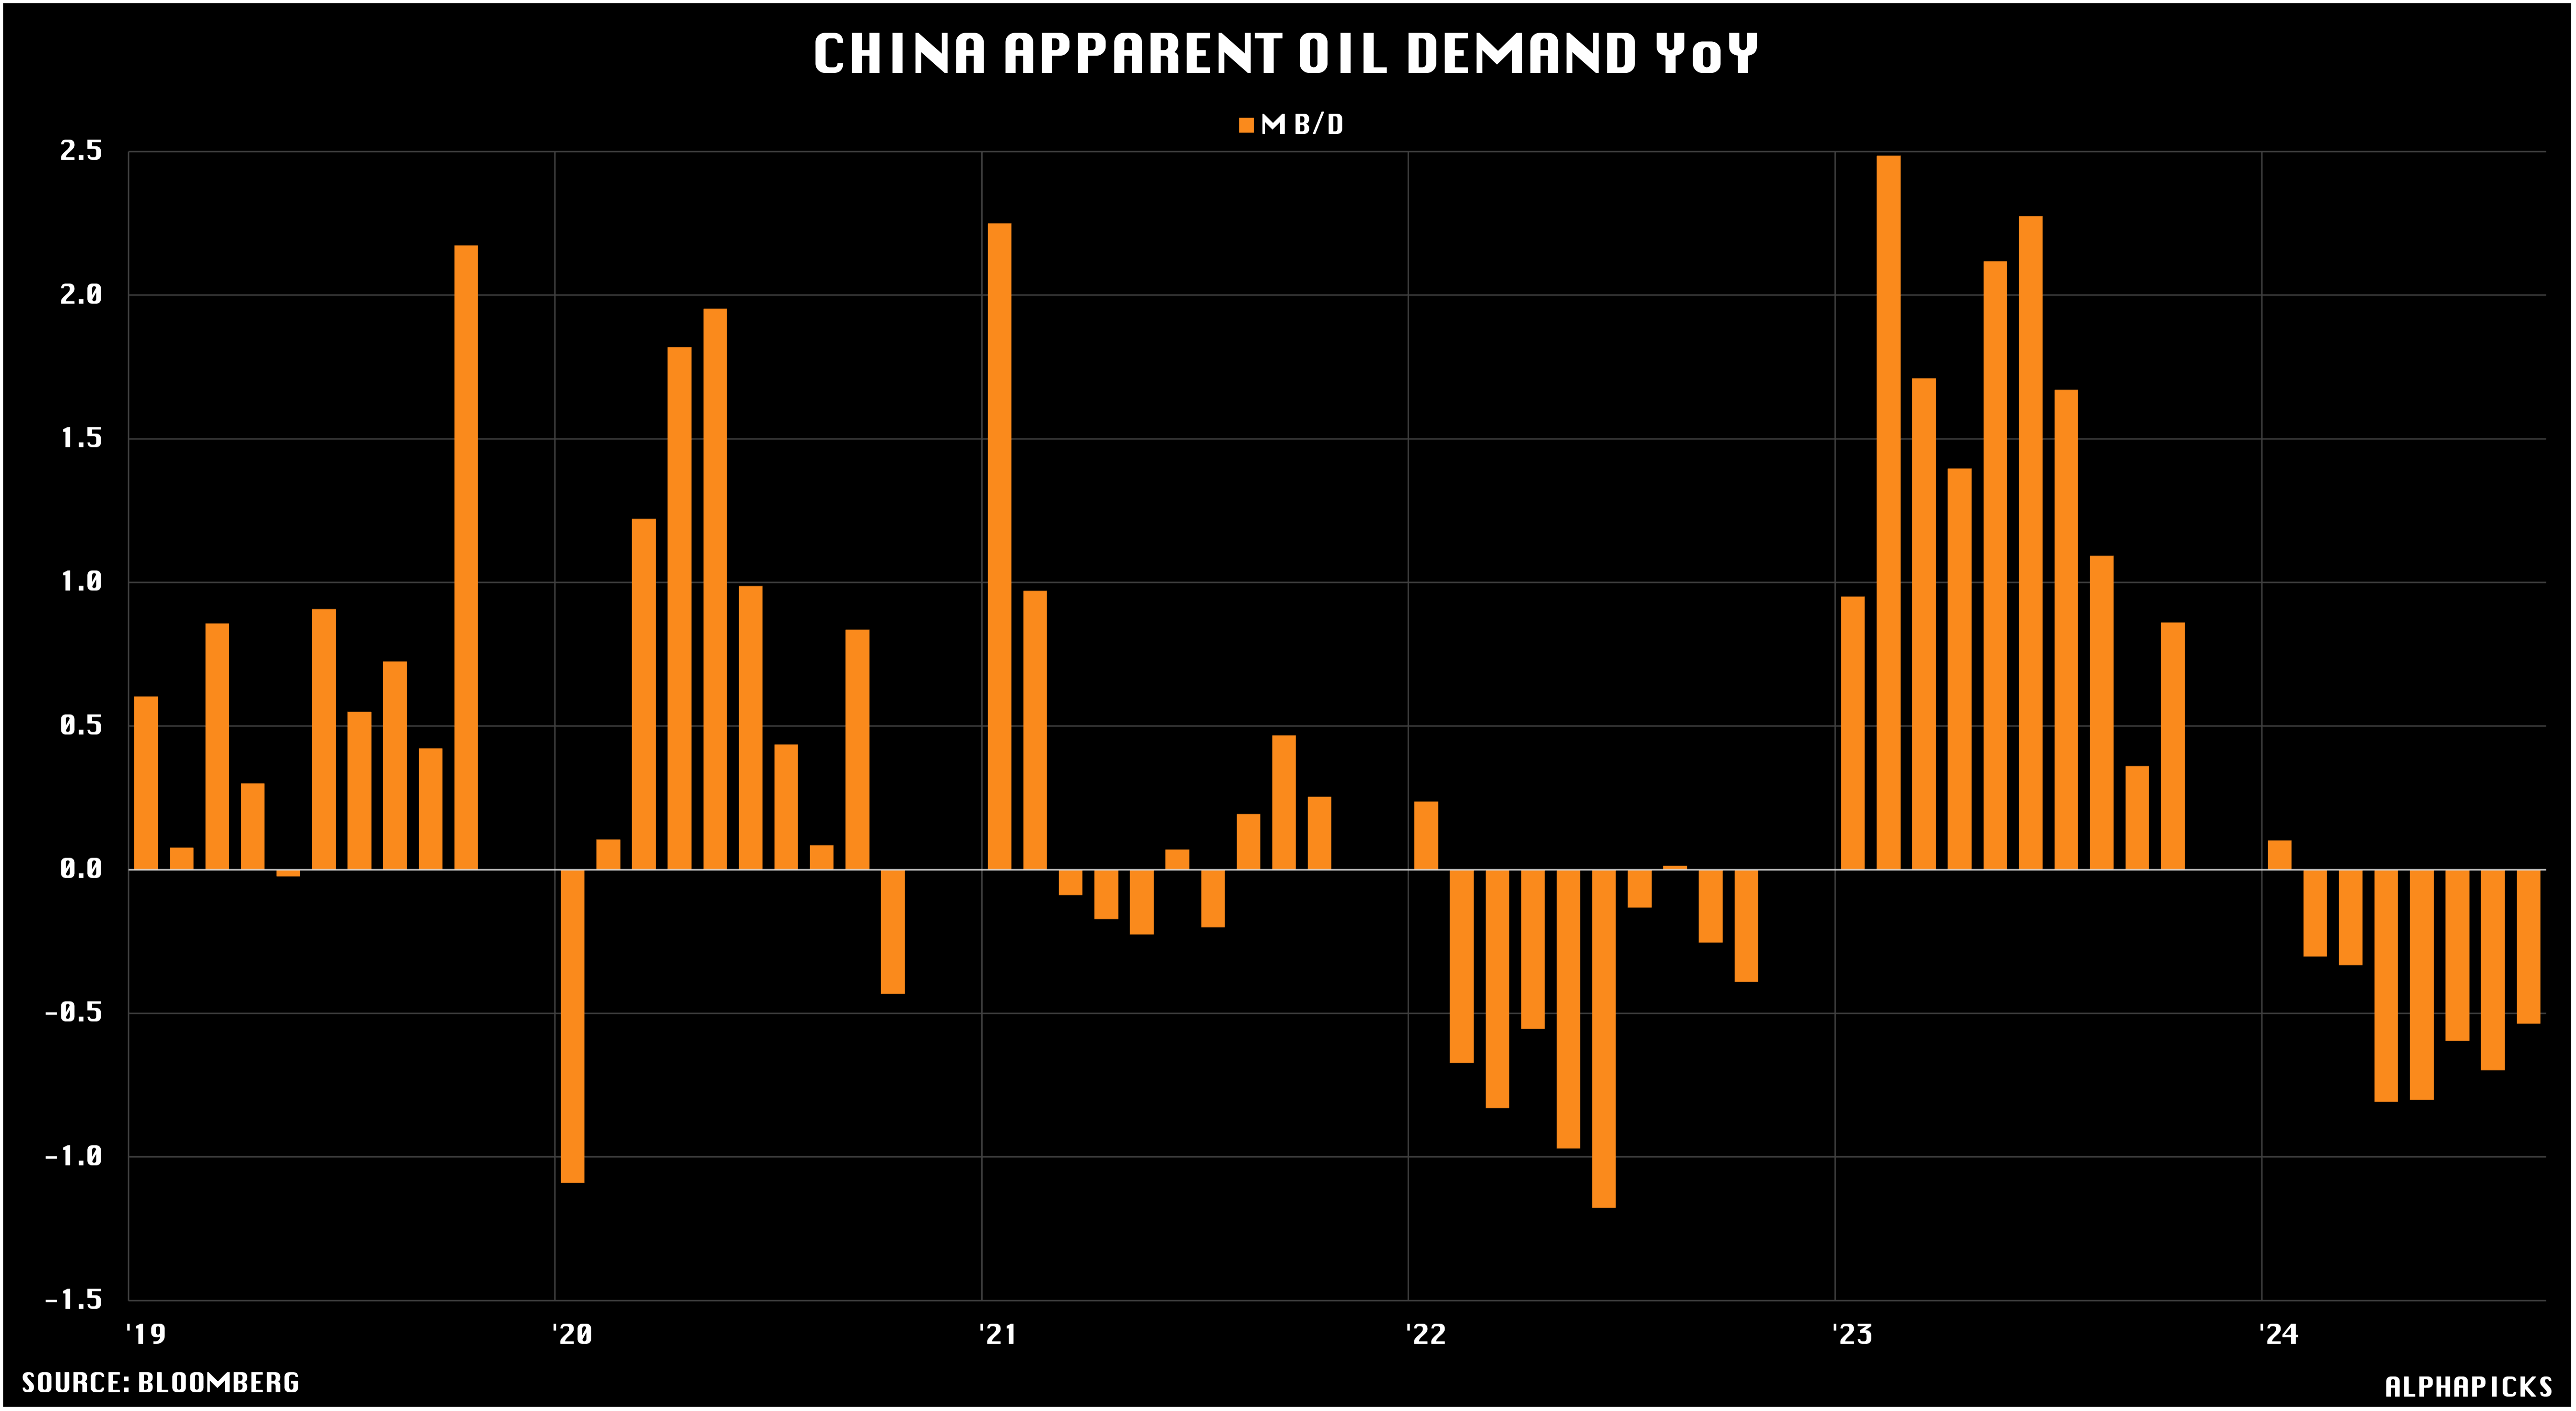
If there weren’t enough reasons to be bearish oil for 2025, then we feel below is one that isn’t being talked about enough. OPEC and voluntary production cuts only work for so long (if they materially work at all), especially when there’s this scale of spare production capacity.

For the moment (and into H1 2025), it doesn’t look like China will be coming to the rescue, with October marking the seventh consecutive month of declining YoY apparent oil demand in the country.
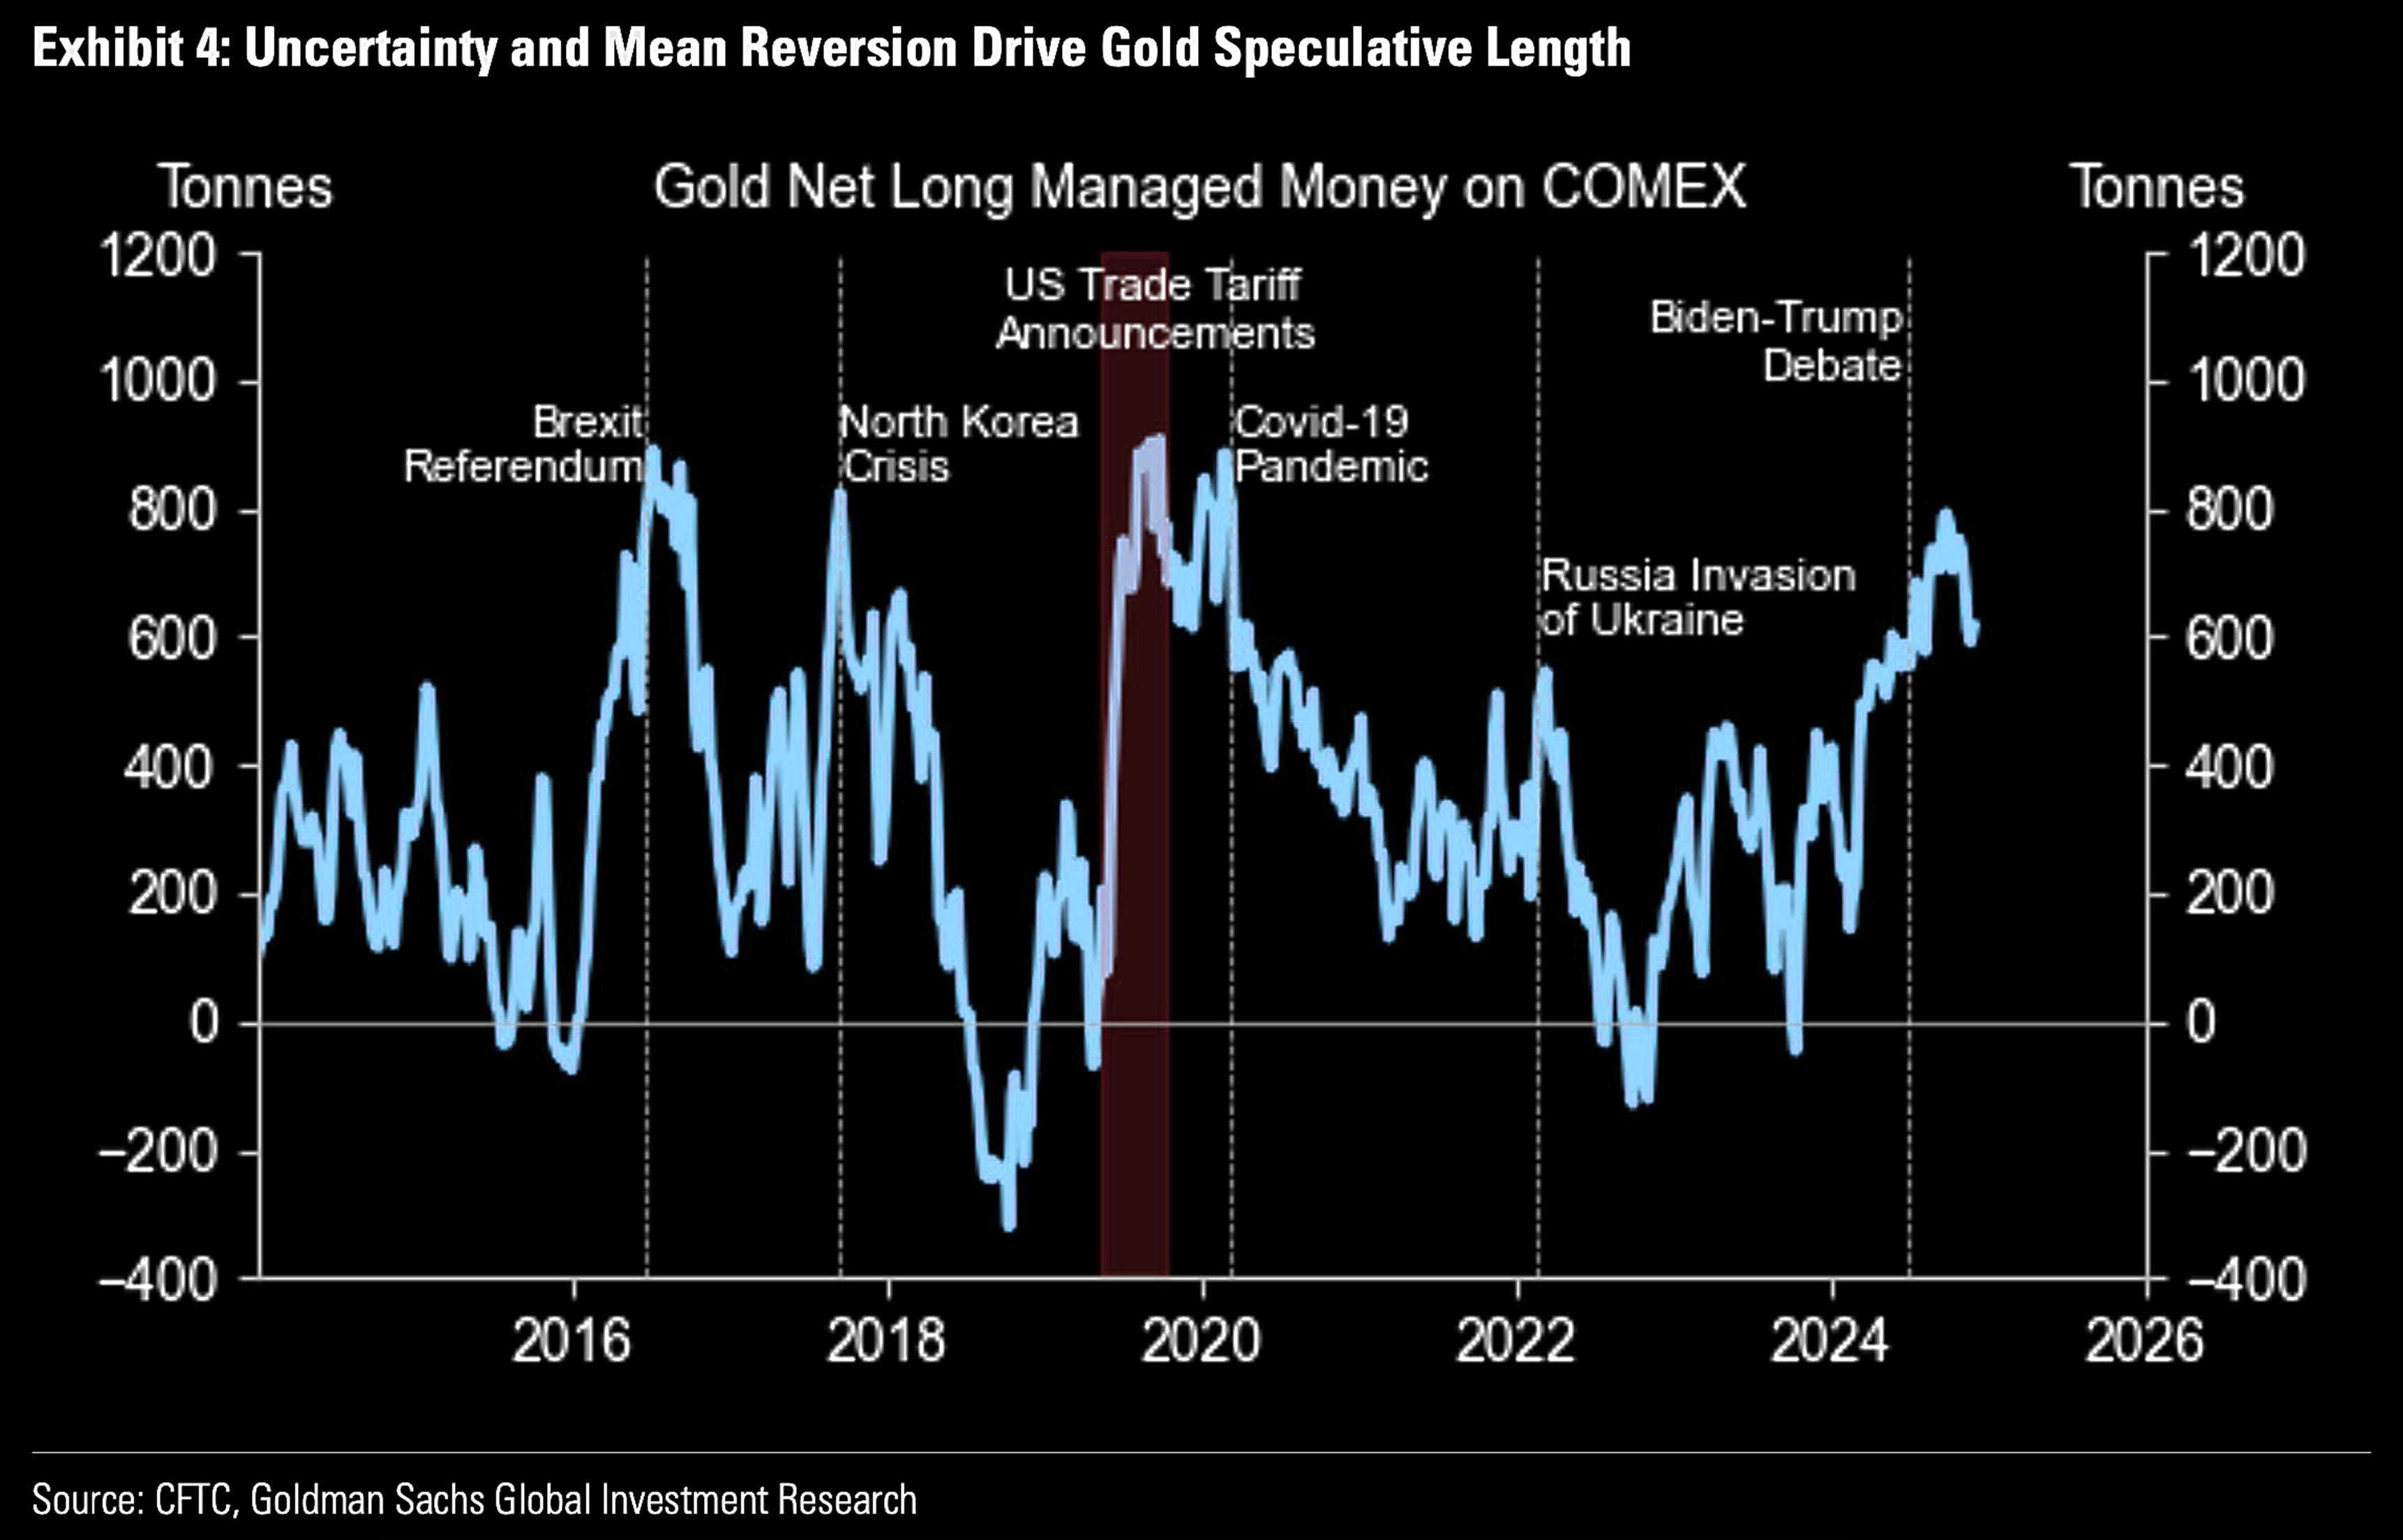
Gold enjoyed a great 2024, but the rally might not be over just yet if history is anything to go by. We flag up the period when previous US trade tariffs were announced, causing a large spike in gold long positioning. Although some of this tariff chat looks to be priced in given current positioning, we don’t feel this is a case of ‘buy the rumour, sell the fact’, and further longs could be added in Q1 with confirmation of implemented tariffs:
And in other news…
The crypto rally didn’t just push Bitcoin above $100k, with meme coins coming back in vogue to a level that puts the market cap of some higher than some household equity names:

That wraps up the chart pack. One more Monday before we start 2025. It’s going to be a great year.
AlphaPicks
Great charts, thoughtful commentary.
Great charts and commenting - I have to pick out two though and underline with my thoughts:
Chart 5 - Inflation compared to 1970's:
There were not a lot of ppl calling for "70s-like inflationary spikes" years ago. I personally fomred that theory since ca. 2020 when they pumped massive money into the economy despite also being responsible for locking it all down at the same time - ie providing a "remedy" for a sickness they caused.
What followed was an unprecedented propping-up of the monetary base that made its way into asset pricing and whatever anyone says, caused the inflation outcome we saw later on.
In the 70s we had very eerie similar signs: the Yom Kippur War had inflamed the Middle East (lockdown of oil markets back then) - spending was out of control in the west. After WWII a lot of funding went into propping up a destroyed economy, ending in a glut in the 60s-70s, while Germany and core Europe had a strong economy thanks to the propping up (Germany: "Wirtschaftswunder") - in the middle of which you could not get a drop of oil thanks to the Yom Kippur and sanctions etc.
2020-2023: massive spike in M2, banks extending credit lines (but less so than 2005-2007), but massive inflow of speculative money instead into assets. Overblown house prices. Aftermath: Stimmy checks propping up "savings" in the middle and then pushing purchase of scarce goods which were not constrained ("supply chain issues"), rather the "ordinary supply" was not ready for the combined "stay at home" and pushing spending massively into sectors that saw a too-high-demand for goods that cannot just be produced that speedily ("chip glut").
What followed was cost increases, wage increases - the usual "doom spiral" of inflation was slowly going into motion... and now we have a 70s like inflationary scenario, but with signs pointing to short-term oversupply in energy/oil (but only in some markets like the US, mind you) - and then we have Europe which is overall energy poor and has long-stemming structural issues and economic weaknesses thanks to insane green energy movement + economic depressive downturns in core markets like France, Italy, Germany.
Sounds stagflationary in EU, maybe inflationary in US/NA to me.
Chart 15: "BoFA Forecast" -
I have to point out here that their analysts seem to be "fact-casting" instead of forecasting... since the 5 spikes they marked are facts... and then to come out and say "we might see an 8-fold increase in shock events" is kind of like saying "I see a danger of more avalanches" after the first three ones already rolled over several villages in the Alps.