


Often, headlines can create concern among investors, concerns that may not have been considered previously. When the noise starts, people listen. Lately, this has been the case regarding the equity supply equation. Mega-IPOs have done the heavy lifting in this regard, along with some Big Tech headlines of standout equity financing. But beneath those headlines sits an equation that has helped shape the modern US equity market. Companies are either creating shares or retiring them, either asking investors to absorb more equity or removing equity from circulation. For much of the past two decades, the second force has dominated. In 2026, that balance remains supportive but is no longer as one-sided.
There is a cleaner way to think about buybacks and IPOs than the usual “froth” versus “fundamentals” argument: strip the equity market back to plumbing. Buybacks are a corporate bid. IPOs and secondary issuance are corporate supply. For valuation, neither leg matters in isolation, but instead the balance between them: net equity supply. Approaching this primer through that lens can help explain much of the modern-day bull market, why the dynamic shift in 2026 is important, and it explains why the late-1990s experience ended so badly once the funding model broke.
The US market is still in a net-negative equity-supply regime in 2026, because buybacks remain very large even as IPOs recover sharply. But this market regime is becoming less generous. Capex is rising (most notably from hyperscalers in the AI buildout), secondary issuance is picking up, mega-IPOs are back in the conversation, and some investors are starting to reward reinvestment over payout.
This is a different dynamic from the one financial markets found themselves in during the height of the tech boom and bust. It does, however, look like the first meaningful test of the post-GFC de-equitisation tailwind. The market has spent years benefiting from shrinking equity supply, but the AI capital cycle may be the first force large enough to test that habit.
Framing the Debate
Markets tend to obsess over IPOs, but their value as a signal is mostly psychological. The scale and breadth of new issuance reveal how much risk appetite is available in the system. But even then, IPOs are only one piece of gross equity supply. Secondary issuance by already-listed companies is usually a larger channel. So the better measure is net equity supply, which includes IPOs and secondary issuances and offsets them against buybacks and M&A-related share retirements. On that basis, buybacks remain the dominant force. Even with the IPO window reopening in 2026, repurchases should still be large enough to keep overall net equity supply negative.
A marquee IPO may draw headlines because of the story, the narrative, or maybe draw concerns linked to valuations ahead of the release. Yet the market impact of an IPO relies on just one thing: whether the market can absorb more supply. A large IPO can be flashy, but it is often smaller than the buyback machine running in the background. Issuance is negative in isolation, but its effect has to be read inside a broader demand-supply framework that includes positioning, flows, and buybacks.
Buybacks are no magic alpha signal, nor are increasing volumes of IPOs automatically bearish. The market impact is reflected in index-level supply and demand. Periods with large issuance can still coincide with strong returns, and periods with heavy buybacks can still disappoint if other factors (such as rates, earnings, or risk appetite) move in the opposite direction.
Let’s start by looking at each side of the equation…
Market Plumbing
Demand
Buybacks reduce free float, support per-share metrics and, at index level, create a structural buyer. US net buybacks reached roughly $914 billion in 2025, up from about $816 billion in 2024, with fourth-quarter activity around $229 billion1. Big Tech alone accounted for roughly $55 billion of that quarterly total. Yet record nominal buyback dollars are far from historical extremes when scaled to operating cash flow. The headline number draws attention, but the support isn’t as overwhelming as it may suggest.
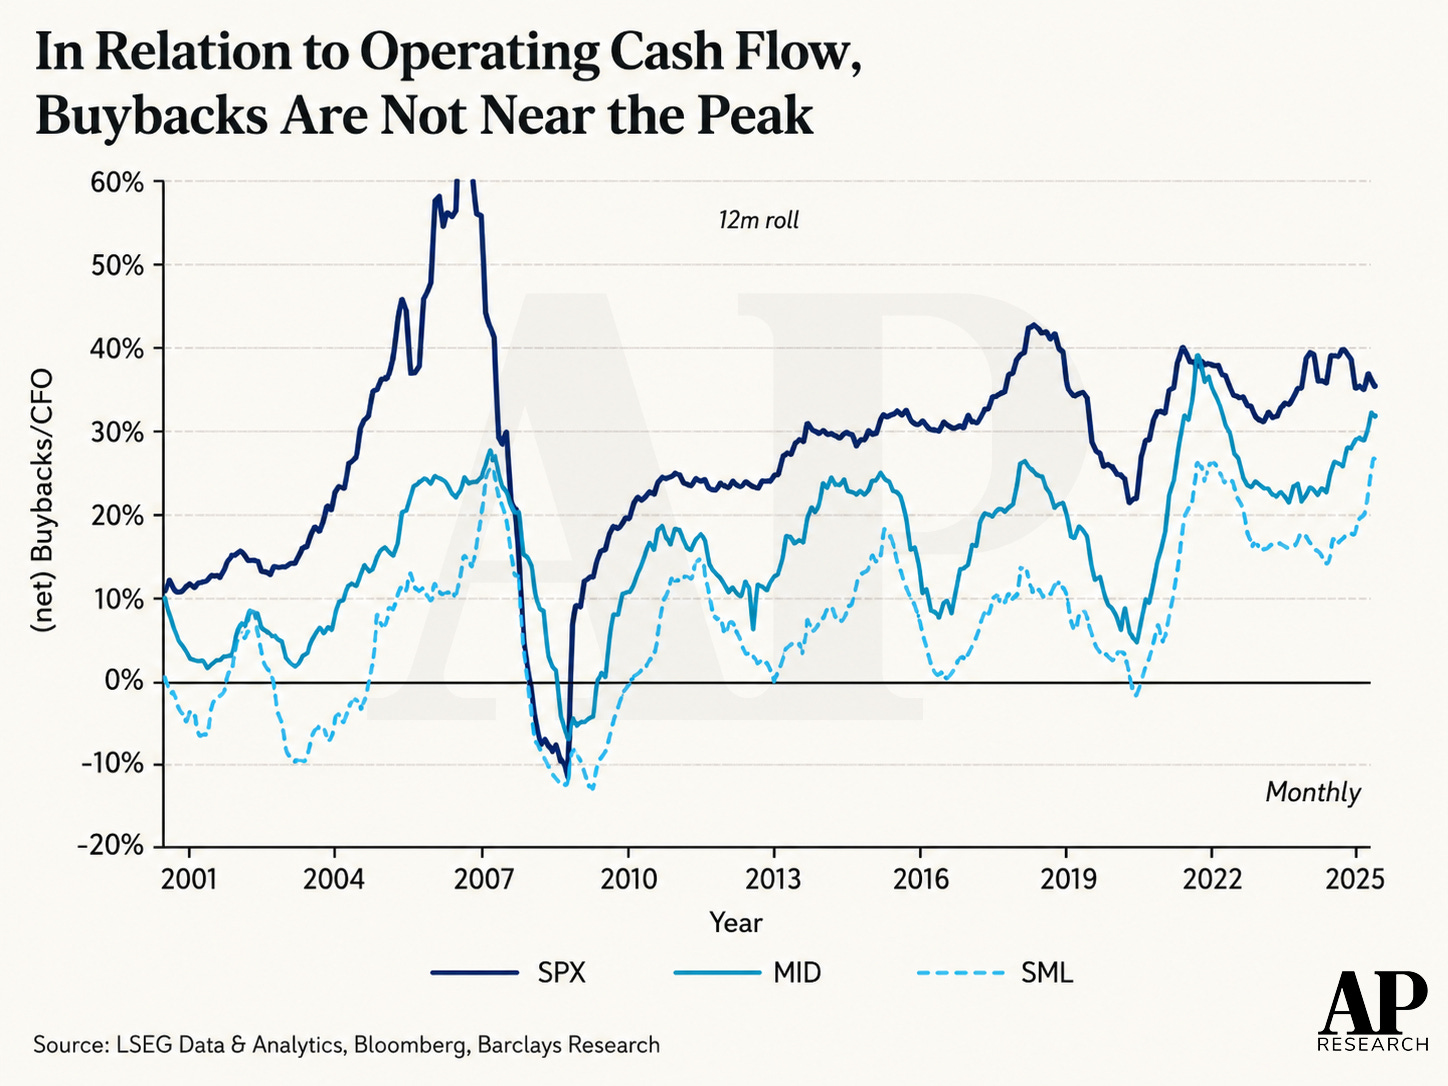
Within the S&P 500 ex-Financials and REITs, buyback activity moderated in dollar terms into late 2025. Corporates instead redirected cash toward capex and liquidity preservation. Yet corporate behaviour remains much the same, with participation unusually broad and the share of S&P 500 constituents actively repurchasing stock close to long-term highs. Yes, the dollars have become more concentrated in the largest firms, but the practice itself remains deeply embedded in US corporate financial policy.
In textbook corporate finance, buybacks don’t change enterprise value. The share count falls, but the company also has less cash, so the two effects should offset. In theory, investors value the company as the sum of its parts and treat a dollar of cash inside the company the same as a dollar of cash returned to them. Buybacks and dividends are simply two routes to the same destination.
In practice, it may come as no surprise that the market is messier. Some investors target fixed portfolio weights, some chase returns, some judge value through per-share earnings, while some treat cash received through dividends differently from cash embedded in a higher share price. Not all investors optimise around enterprise value. This is where the “endowment effect” comes into play. Investors often demand more to give up an asset they already own than they would be willing to pay to acquire it fresh. Applying this framework to buybacks, it means shareholders may require a higher price to sell stock back to the company than they would be willing to pay if the same cash had arrived as a dividend and they were deciding whether to reinvest it.
If a company pays a dividend, some of the cash may be consumed, held in money-market funds, allocated to bonds, or diversified across the broader market. If, instead, the company buys back stock, it directly removes equity supply. Investors who still want the same proportional exposure to equities then have to compete for a smaller pool of shares. In that setting, the adjustment comes through price.
This is why buybacks at the index level look different than at the company level. It’s a flow. When the corporate sector retires equity and investors are slow to reduce their desired equity allocation, the market-clearing price rises. The exact impact is uncertain, but Elm Wealth’s framework2 suggests that buybacks on the order of 3% of the market could plausibly lift prices by 3-5%. The same happens on the flip side. If the buyback bid fades, or if large-scale issuance starts increasing the equity float, the same supply-demand logic can begin to work against the market rather than for it.
Yet, it would be a false step to romanticise about buyback behemoths. Stocks with above-median buyback yields have looked cheaper than the broad market, yet have underperformed over the past five years. Buybacks can support the tape and are far more important at the index level, but fall short of providing any edge at the single-stock-picking level.
Supply
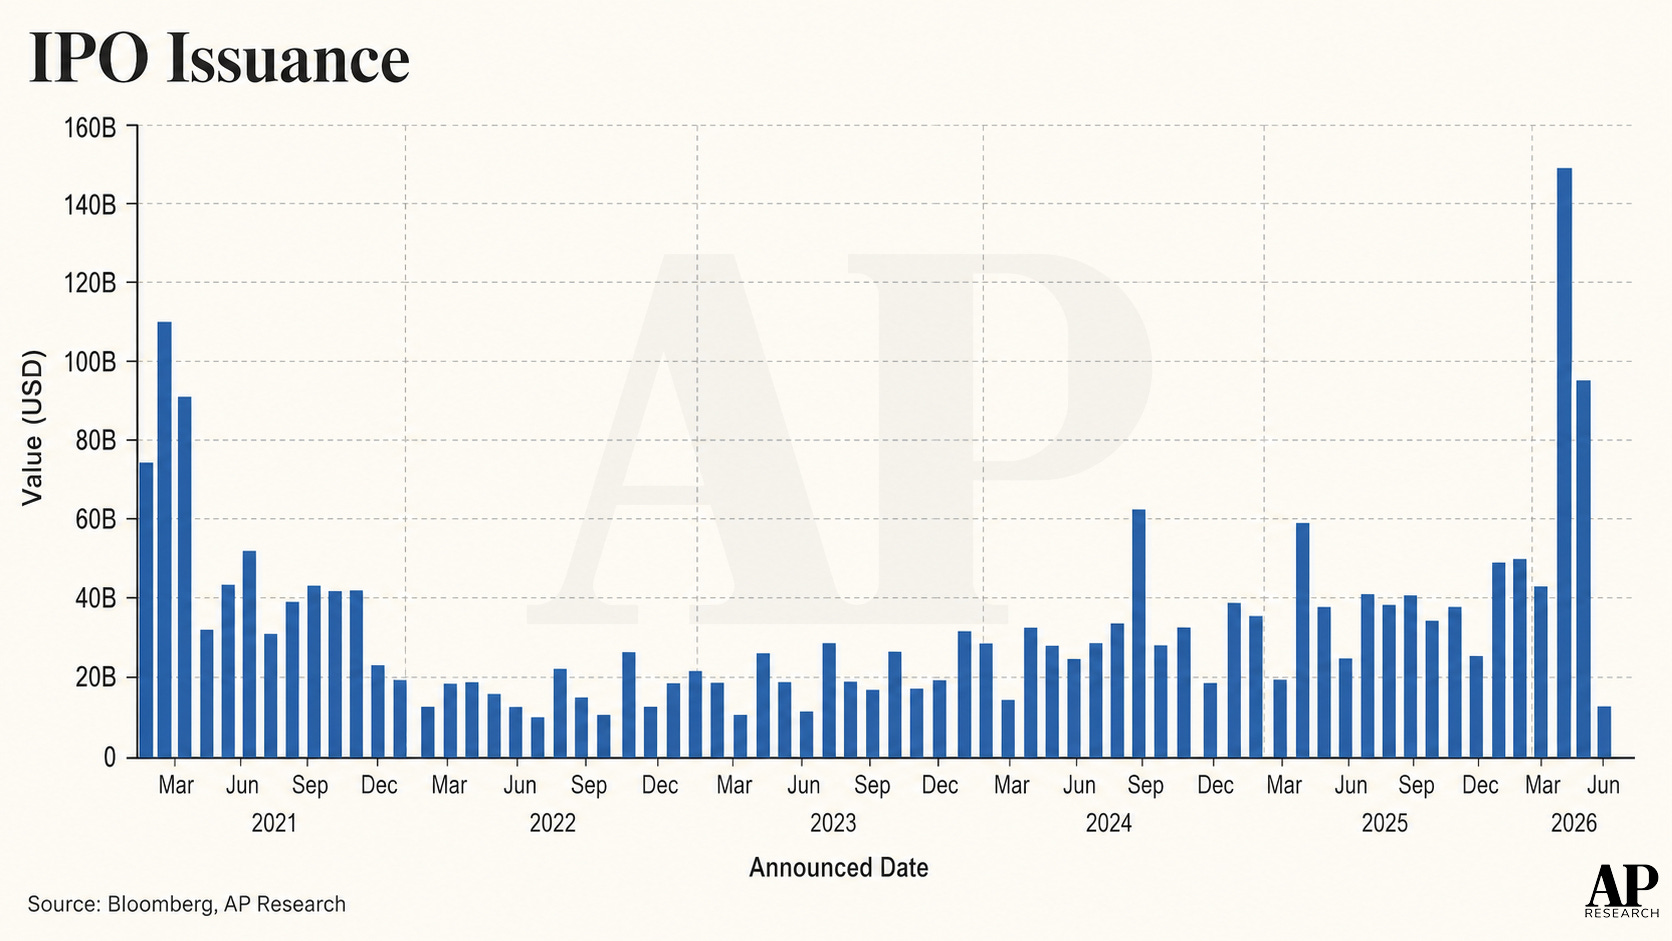
IPOs are different, and where the plumbing gets more subtle. US IPO proceeds could reach roughly $160 billion this year, which would make it the biggest year on record in dollar terms. Taken at face value, that sounds late-cycle. Historically, the years with the largest IPO dollar issuance have often been followed by weaker returns over the next 12 months. But the dollar figure is the wrong denominator. The US equity market is much larger today than it was in 1999, 2007 or 2014, so the same nominal issuance number now represents a much smaller absorption challenge. Normalised by S&P 500 market capitalisation, 2026 IPO supply sits only in the second quintile, away from prior market-top extremes.3
Deal count tells the same story. A true IPO mania is a broad rush of companies trying to capture an open window. While 2026 could be a record year by proceeds, the number of IPOs is likely to sit slightly below the 30-year average. Supply remains concentrated. The market is being asked to digest a handful of very large deals, rather than a late-1990s-style flood across every sector. Broad-based issuance tells you much more about speculative excess than a small number of trophy transactions.
Another important point is that IPOs are only a portion of equity supply. They attract more attention than secondaries because they are pro-cyclical and easy to narrate. Recall your minds back to mid-June and how much attention SpaceX’s IPO release had. But secondary issuance from already-listed companies usually contributes more to gross equity supply than IPOs each year. IPOs appear when companies can issue, while secondaries often appear when companies need to issue. As is often the case, the full story, the full picture, or in this case, the full equation is needed instead of one aspect out of context.
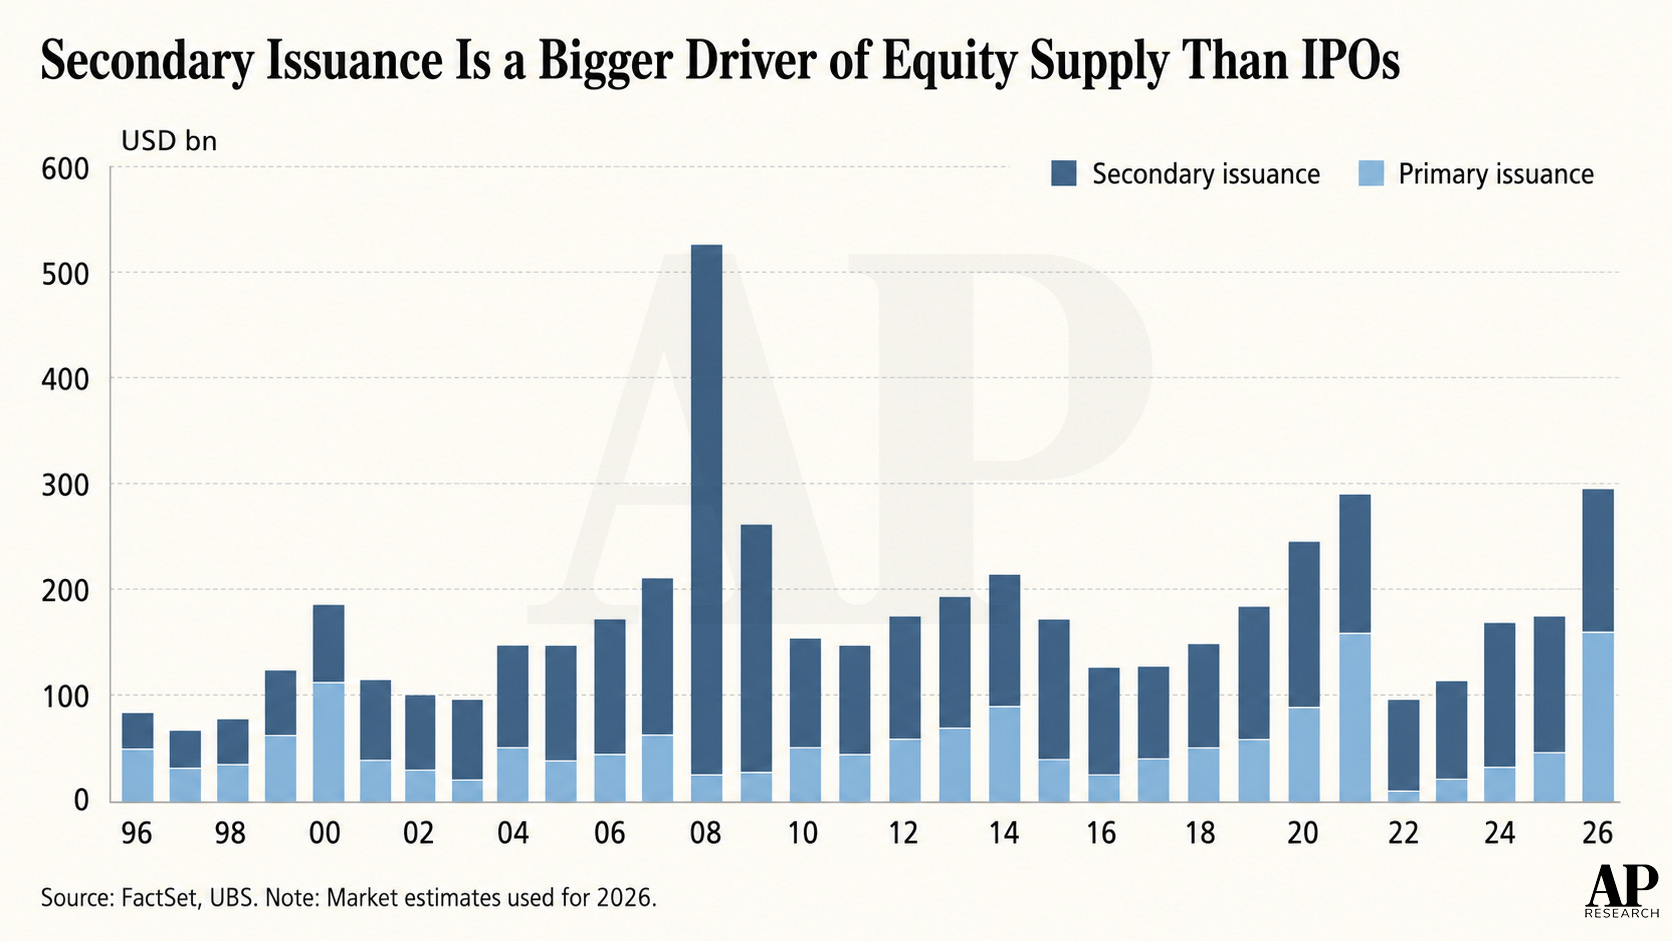
Viewing the dynamic in its full context is therefore the best lens when assessing equity issuance and its impact on the market. Start with IPOs and secondary issuance, then offset them against buybacks and M&A-related share retirement. In that equation, the US market is expected to remain net negative in 2026, with buybacks remaining the largest force in the equation, even if IPOs may be the loudest channel. The correct concern for markets should be that IPOs and secondaries rise alongside buybacks becoming a smaller tailwind.
A Long Era of Buybacks
Let’s turn now to the recent history of the equity supply equation, and why the net result has underpinned the modern bull market.
Over the last 10-15 years, US equities have operated in a regime in which corporates have often been shrinking rather than expanding their equity base. Buybacks have usually been the dominant force keeping US net equity issuance negative, and today’s elevated valuations have been supported not only by stronger earnings and free cash flow but also by more negative net equity supply than at prior market tops. In the late 1990s, valuations rose to even loftier levels despite buybacks being small and net supply being much less negative.
This regime underpinned the resilience of the post-GFC and post-pandemic market, even amid a challenging macro backdrop at times. A market in which companies are persistently taking stock out of circulation has a built-in cushion that the late-1990s market did not have to the same extent. The modern bull market has been helped by a structural de-equitisation story.
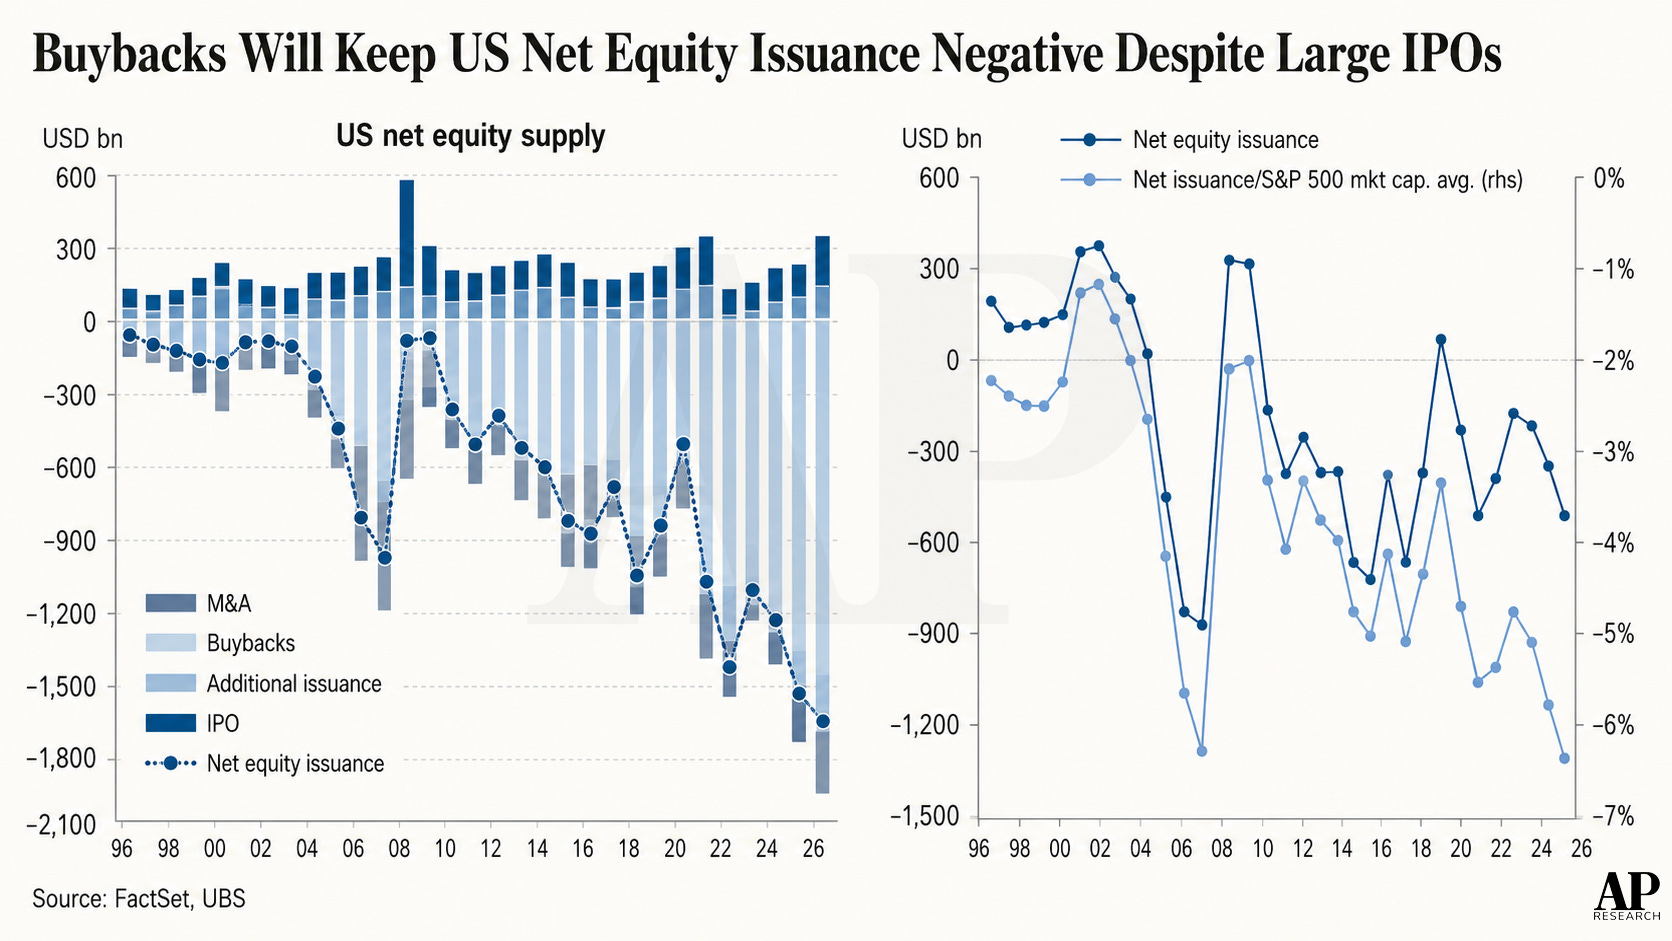
This is also why the last decade’s multiple expansion is not separable from the buyback machine. The US P/E multiple rose by roughly 4% per annum over the past ten years, and a 3-5% potential annual price impact from buybacks offers one explanation. The result is a market that appears richer as profits improve and the available equity supply shrinks. The important restraint is that this is not a free lunch. If buybacks lift today’s price without lifting the firm’s underlying assets or earnings power, then they also lower forward expected returns. The long-run welfare gain is less obvious than the near-term market impact. Buybacks support the tape, but if they replace productive reinvestment with excess cash distribution, they borrow from the future to bid up the present.
This pattern has not been linear. One example came earlier this decade. After the 2022 spending surge, companies became more conservative with cash usage in 2023. Buybacks slowed alongside debt discipline improving, and management teams conserved liquidity amid macro uncertainty and rising rates. That was an early sign that the buyback machine, while powerful, remains cyclical and sensitive to changes in cash flow and investment needs.
Why 2026 Feels Different
In 2026, the flow may change. The supply/demand line is still negative, but it is moving sharply less so as primary and secondary equity issuance rises… a change in market weather. The same inelastic-market logic that made buybacks powerful on the way up can also work in reverse when supply rises.
The forward-looking risk is that large-scale equity issuance by capital-intensive AI companies could have the opposite effect of recent history’s record buybacks. We are now asking whether the next AI funding wave turns the corporate sector from a net absorber of equity into a larger issuer of it. So far, spending has been debt-funded, but Alphabet’s $80 billion equity deal stands out as the primary example of a hyperscaler tapping equity markets specifically for AI capex.
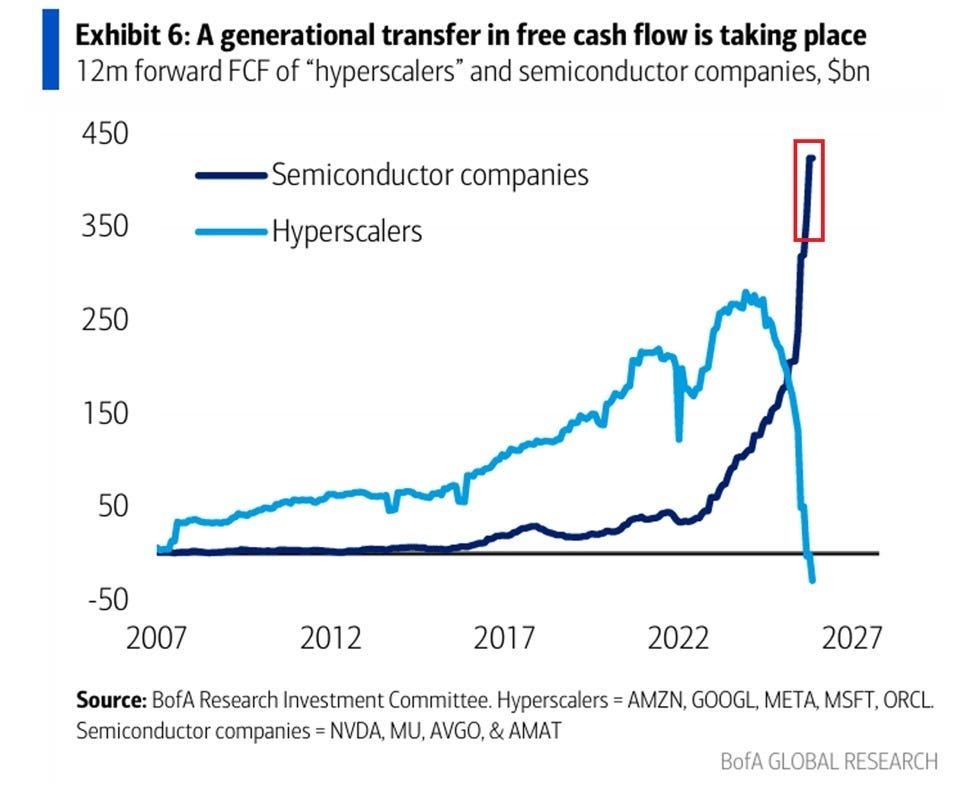
Two legs of the equation are moving simultaneously. On one side, IPO issuance is rebounding sharply. Market expectations are that US IPO proceeds will quadruple to a record $160 billion in 20264, marking the biggest IPO year on record in dollar terms. On the other side, buybacks remain large but face a more serious rival for cash: capex. The five main hyperscalers have driven most of the recent capex surge, and for that group, capex has grown much faster than earnings, pushing quarterly net buybacks from roughly $30 billion to essentially zero.
This differs from the whole market, though, and makes 2026 more nuanced than a “capex crowds out buybacks” conclusion. Companies benefiting directly from hyperscaler spending are raising their own buybacks (many may have seen the below FCF chart that did the rounds online recently). The broader S&P 500, still responsible for the bulk of earnings and buybacks, increased quarterly net buybacks from about $180 billion to $240 billion over the last year. Hyperscalers are weakening one part of the corporate bid, but they are indirectly strengthening another.
There is also a behavioural shift under the surface to note. In software, at least, investors have recently rewarded aggressive AI-related R&D and capex over buybacks. In an AI-disrupted sector, the evolutionary rule of “adapt or become obselete” is behind this behavioural change, and highlights the markets valuation of discriminating about when cash return is supportive or when a reinvestment story is more credible. A decade of blindly preferring lower share counts over higher spending is different to the regime we are now in.
Taken together, 2026 feels like a transition year. The market still has a supporting corporate bid, and US buybacks in 2026 are expected to remain around 2-3% of market capitalisation. But that support looks less one-sided.
A Dot-Com Reflection
“2000 was a little different. 2000 was the easiest bear market I’ve ever seen my whole life. It’s got so many similarities to right now, in the sense that the bear market of 2001 and 2002 were a consequence of all the IPOs in ‘99 and 2000. And then as they unlocked, you just had this never-ending cascade of selling.” — Paul Tudor Jones
Alongside high valuations, the late 1990s were a period of aggressive, broad-based equity issuance into an investor base willing to fund narratives rather than cash flow. 392 US IPOs came in 1998 and 512 in 1999, with average first-month gains of 16.5% and 91.3%, respectively. The IPO machine may never have been hotter than it was in this period.
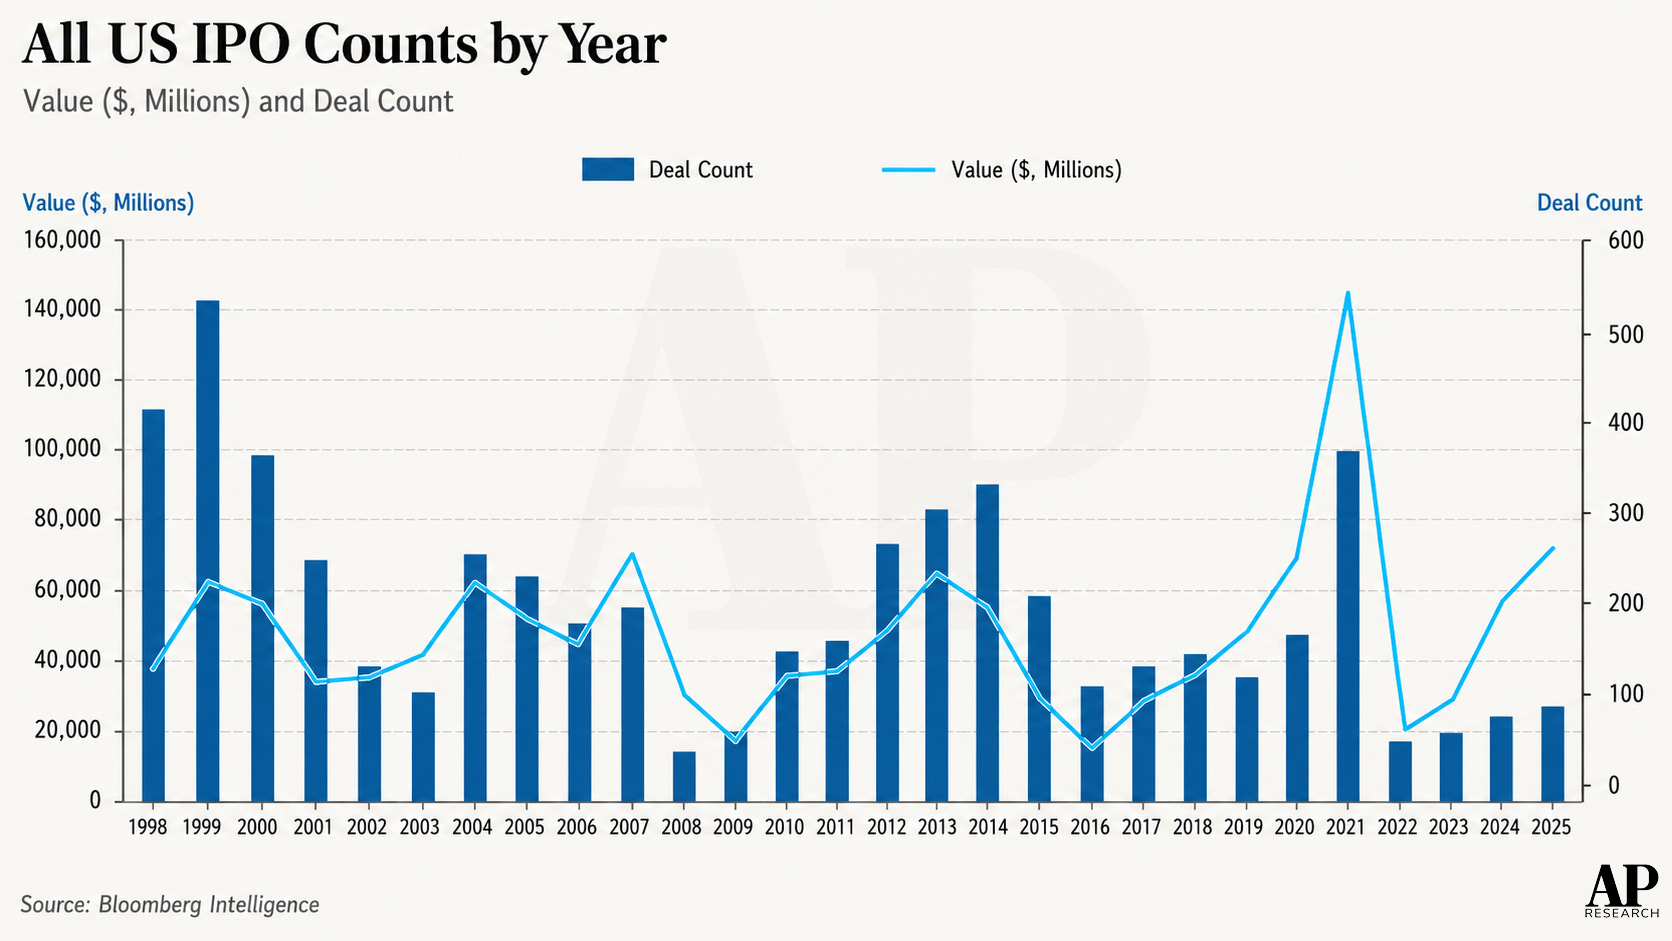
Issuance hurt the market due to financing dependence, rather than share dilution. Many telecom and fibre companies built capacity ahead of demand (dark fibre was the archaeology of the dot-com bust), using fragile debt and equity funding, while pure dot-com names such as Webvan, eToys and Pets.com were negative-EBITDA, cash-burn models dependent on fresh capital to survive. Once the Nasdaq cracked, the IPO market froze, equity funding disappeared, debt markets stopped refinancing weak balance sheets, and the model collapsed. The bust was, in that sense, a funding-stop event.
The numbers underline the difference between then and now. Today’s market, while expensive, remains far inside the profit-detached extremes of 1999-2000. Implied-yield spreads for high-momentum stocks are around -1.5% versus the market and -2.1% versus low momentum, compared with roughly -6% and -9%, respectively, at the bubble peak. Aggregate market cap to forward Economic Profit ratio is around 29x, elevated relative to history but below the high 30s seen at the tech bubble apex. Today’s largest companies command large weights because they are generating large profit pools, whereas many of the biggest TMT names in 2000 were carrying more market value relative to profits that later faded or never truly arrived.
The comparison between then and now must be made at the correct layer. The rhyme is more to whether the marginal parts of the ecosystem are becoming reliant on continued external capital in a way that would be lethal if the window shut, whether that’s debt or equity financing. The largest AI spenders are mostly funded from operating cash flow and debt financing, unlike the centre of the dot-com bubble. Debt investors have been happy to absorb the issuance so far, while equity investors have largely rewarded the practice, treating today’s capex as the price of future dominance rather than a sign of financial strain.
The takeaway from the dot-com era? High issuance does not create a crash. However, equity issuance becomes dangerous when it’s part of a broader market architecture in which unprofitable or overbuilt business models need continuing access to fresh capital.
Four Factors to Watch
Whether the net supply/demand balance moves closer to zero will be a continued debate this year and further out as the AI buildout continues. If earnings accelerate, it can counterbalance concerns about reduced buybacks. Demand for equity issuance remains strong, as evidenced by the recent SpaceX IPO (reportedly three-and-a-half to four times oversubscribed). What remains a key risk for the market is a combination of concerns: reduced buyback support, rising primary/secondary issuance, and earnings fading amid already high “priced for perfection” expectations.
The first factor to watch is aggregate net buybacks instead of headline IPOs. As long as the broader S&P 500 continues to offset weak hyperscaler buybacks with strong buybacks elsewhere, the corporate bid remains alive. If that broader participation starts to roll over alongside a larger issuance pipeline, the market loses one of its most important structural supports.
The second is the financing mix of the AI capex cycle. If core spenders continue to fund primarily from free cash flow and debt financing, today’s set-up remains very different from the late-1990s equity-funded boom. If, however, more of the capex burden migrates toward secondaries, the comparison to the dot-com period grows less rhetorical.
The third is whether issuance stays concentrated. Record proceeds are not matched by dot-com-style deal counts or by a market-cap-adjusted supply shock. If that changes, if the big IPOs are followed by a much broader and more indiscriminate new-issue wave, then the signal shifts towards late-cycle enthusiasm.
The fourth, and maybe the most important, is earnings quality. Buybacks and issuance shape valuation, but earnings and free cash flow still decide whether the market can carry the supply. In that sense, the question is whether strong profits can keep outrunning a less benign supply backdrop.
Bottom Line
Buybacks remain a fundamental supporting bid, and IPOs are indeed an aggressive supply channel. But the market has lived for years with the first force dominating the second. In 2026 that balance is no longer one-sided. Still supportive, yes, but less so than recent history. Whether the AI capital cycle may be the first force large enough to test that habit is the key concern.
As usual, your support for these primers is appreciated. They continue to be our most-read series and work. We welcome you to share comments and your opinions. For more primers, you can see our full library here.
AP
Barclays Equity Research, “U.S. Buyback Monitor” (Apr-2026)
Elm Wealth (Oct-2025), https://elmwealth.com/stock-buybacks/
UBS Global Research, “15 Essential Charts: Does the IPO market signal a market top?” (Jun-2026)
Goldman Sachs estimates (Fed-2026)
Banger as usual!
As long as you have buyers …