

Global Primer Series: Precious Metals (Silver)
Understanding the drivers behind silver and how to trade it.
Silver has returned to the macro spotlight as a tightening physical supply meets a resurgence in financial demand.
The metal occupies a distinct position in global markets, both as a precious metal held for investment and as a critical industrial input consumed in manufacturing, particularly in solar, electronics, and electrification infrastructure. That dual role means silver responds not only to real rates and currency dynamics, as gold does, but also to fabrication cycles, inventory management, and commodity financing conditions.
However, the physical market tightened as years of underinvestment met rising demand from solar, electrification, and defence electronics. Financial flows turned pro-cyclical, ETF creations absorbed thousands of tonnes, lease rates spiked, and the curve flipped into backwardation, revealing how little truly free inventory there was.
Price strength through 2025 reflected these structural pressures. However, early this year, silver quickly became a speculative bet as availability declined across both the physical and financial markets, reinforcing its sensitivity to liquidity, positioning, and supply-chain rigidity.
Now, silver is trading less as a leveraged expression of gold and more as a hybrid asset shaped by industrial demand, balance-sheet capacity, and the mechanics of the bullion market.
In this primer, we’ll consider the following:
Drivers of Price Action
Market Structure
Notable Historic Events
Trading Strategies
Market Participants
Key Drivers
Demand Dynamics
Silver’s demand profile continues to evolve in ways that structurally distinguish it from other precious metals. In 2024, industrial use accounted for approximately 58% of total silver demand, dwarfing jewellery and investment in many regions.
Within that industrial bucket, photovoltaic (PV) consumption alone absorbed roughly 170 million ounces, making solar the single largest end market, followed by electronics and electrical applications at about 140 million ounces combined.
In itself, the broader electrification trends, which include themes like power distribution infrastructure and advanced semiconductors, are a key factor in why we believe silver can keep moving higher in the medium term.
Supply Metrics
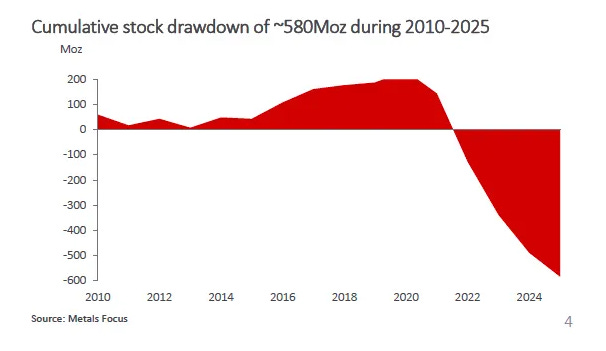
On the supply side, silver’s market dynamics reflect persistent tightness rather than surplus. The global silver market has now recorded five consecutive years of deficits, with the 2025 shortfall projected at about 118 million ounces, according to industry estimates.
Mine supply averages roughly 800-850 million ounces per year. Recycling adds a variable secondary stream.
Primary mine output is constrained by the fact that roughly 70–75% of silver is produced as a by-product of base metal mining. It has grown at a muted 1–2% per year, which is insufficient to offset rising consumption and again supports a conviction that silver is heading higher over the coming year.
Unlike primary commodities, higher prices do not quickly translate into new production because mine plans are driven by the economics of base metals rather than silver. That structural linkage leaves the supply side relatively inelastic, with incremental availability coming mainly from scrap flows. In practice, a significant portion of privately held silver (particularly heirloom holdings across parts of Asia) rarely re-enters the market, limiting the extent to which recycling can respond even during periods of elevated prices.
Liquidity Contraints
Liquidity and positioning act as the third driver. Silver futures are thinner than gold, ETF inventories are smaller, and physical availability is more constrained. As a result, speculative flows, CTA positioning, and options hedging exert disproportionate influence on short-term price dynamics.
This is why silver tends to overshoot both up and down. It is not just directionally sensitive. It is mechanically convex.
A good example illustrating this came in December last year. The month began with the market already tight after the October London funding shock (lease rates north of ~11% at the peak of the squeeze), and with most London vault inventory effectively unavailable to the spot market (end-September holdings were ~24,581 tonnes, remember ~83% was allocated).
Amid the thinner year-end liquidity, spot silver printed successive upside air pockets just before people started leaving for the holidays.
The critical point for shorts was that the physical market never really “relaxed” even when the price wobbled. Bullion market reporting still showed London lease rates around ~6% in early December, an extreme financing signal for a liquid precious metal and consistent with a scramble for borrowable ounces.
As momentum funds and dealer hedging joined the move, the squeeze phase migrated from financing spreads into outright price, culminating in the late-month vertical as silver hit $77.40/oz on 26 Dec and later cleared $80/oz before year-end.
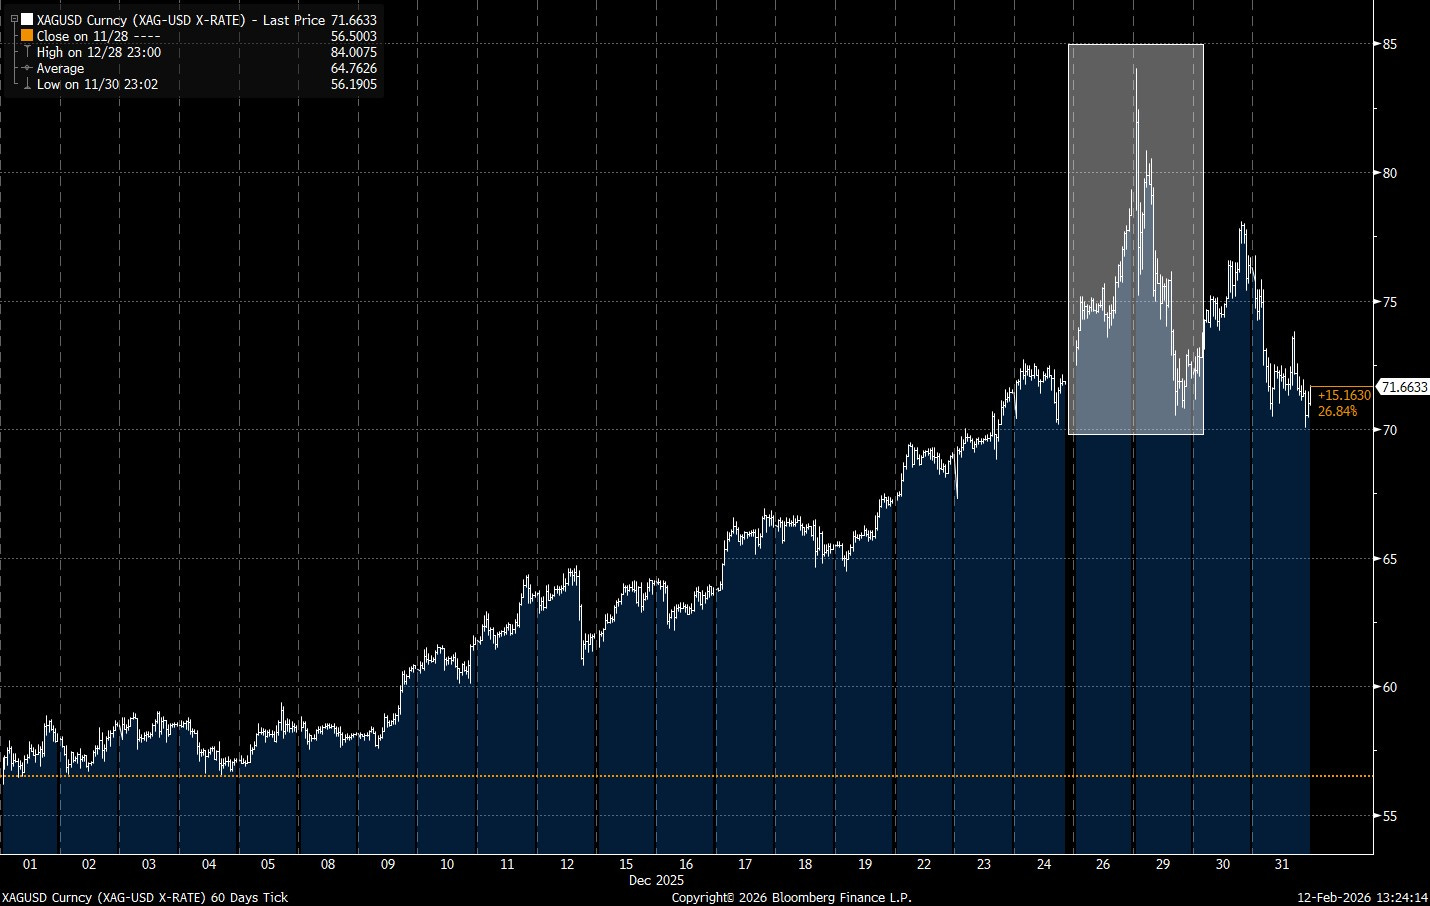
In parallel, investor vehicles pulled incremental metal out of circulation: silver exchange-traded product inflows surpassed 4,000 tonnes, reinforcing the “available float” problem that makes short futures exposure fragile when delivery optionality suddenly becomes binding.
Correlations
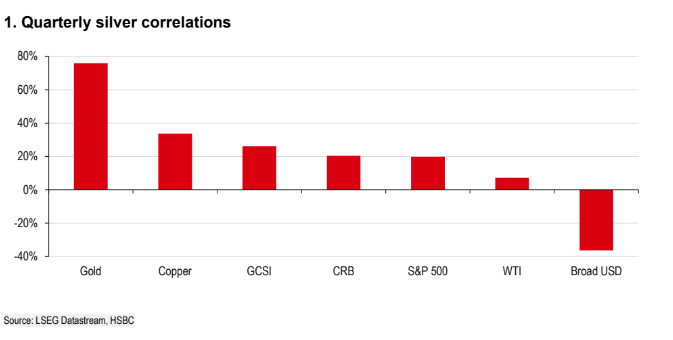
Silver’s cross-asset correlation profile reflects its dual role as both a monetary and industrial metal. The strongest relationship remains with gold, where shared sensitivity to real rates and global liquidity conditions anchors silver firmly within the precious-metals macro complex.
The positive, but materially lower, correlation with copper and broad commodity indices (GSCI, CRB) captures silver’s partial exposure to global manufacturing and electrification cycles, particularly via electronics and solar demand.
More modest correlations with equities and crude oil reflect silver’s tendency to participate episodically in reflation and risk-on environments, but it is not a consistent proxy for growth or energy.
Finally, the negative correlation with the broad dollar speaks to the opportunity cost of holding an asset with yield versus one without. A higher interest-rate environment typically sees a bid for the greenback, with a wider carry differential against silver (and vice versa).
Market Structure
The global silver market mirrors gold in architecture but not in depth. Annual turnover across London and New York comfortably exceeds $5–7 trillion notional, yet the amount of metal that can be mobilised at short notice is a fraction of that implied liquidity.
Liquidity is split between the OTC market, coordinated through the LBMA, and exchange-traded futures, primarily on COMEX via the SI contract. Average daily volume on COMEX typically runs 60–80k contracts (equivalent to 300–400 million ounces), or more than one-third of annual mine supply changing hands each day. Open interest, however, represents claims on metal that are often 5–7x larger than registered deliverable stocks.
The London market dominates physical clearing, unallocated balances, and institutional custody. Roughly 85–90% of global spot transactions are estimated to price off the LBMA loco-London market, where bullion banks act as intermediaries between buyers. Pricing here reflects physical availability, lease rates, and balance-sheet conditions rather than futures sentiment alone.
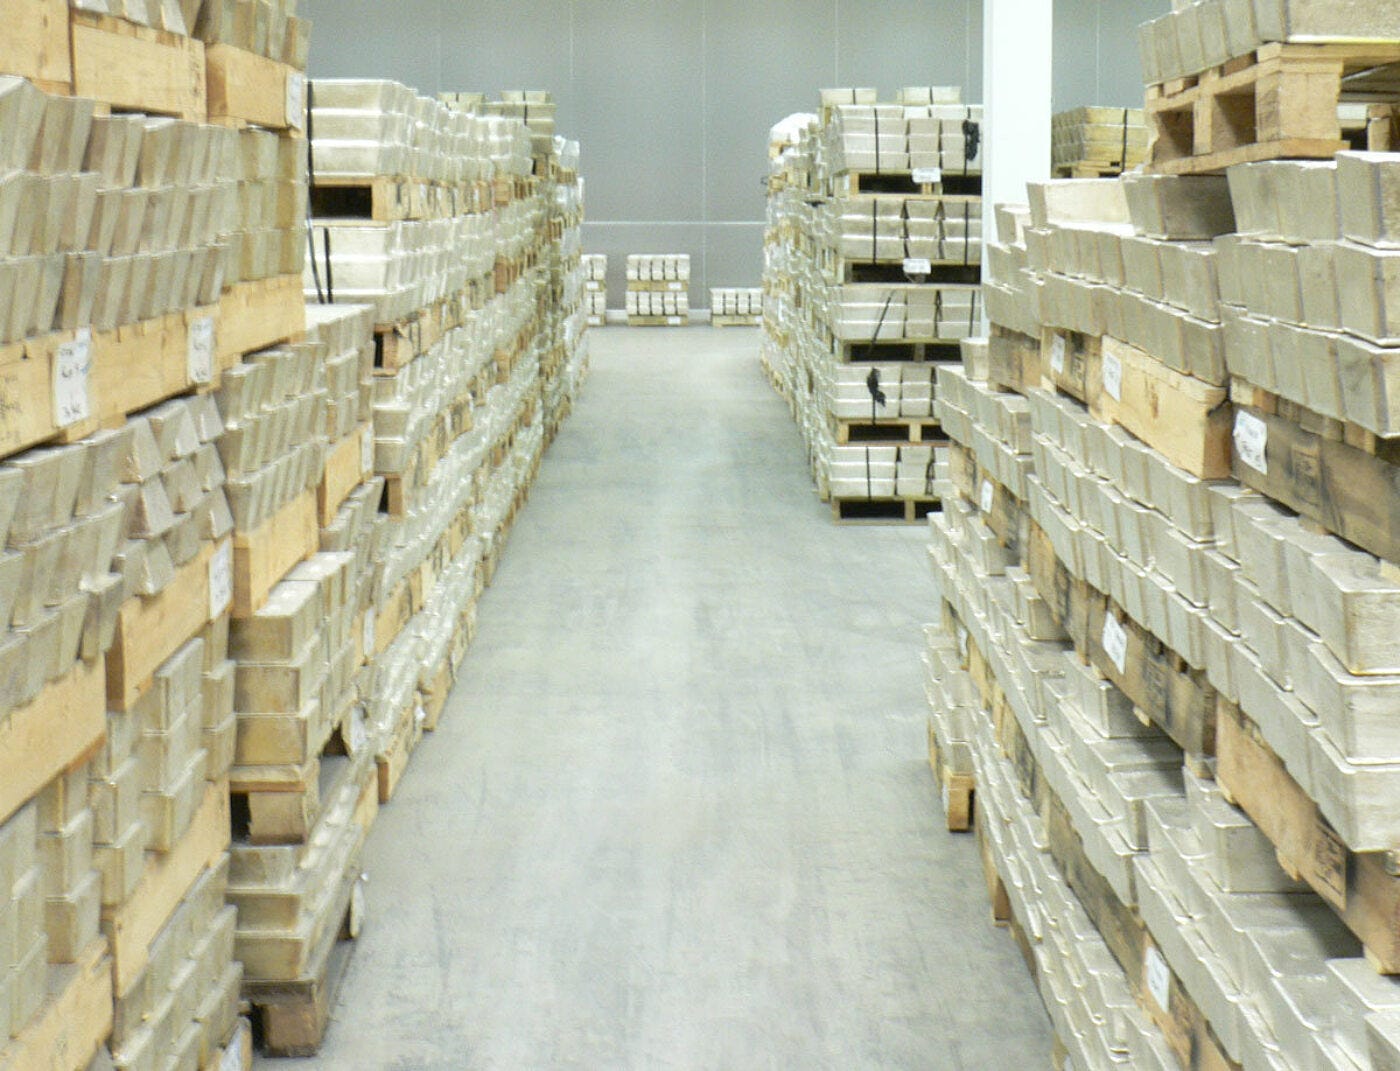
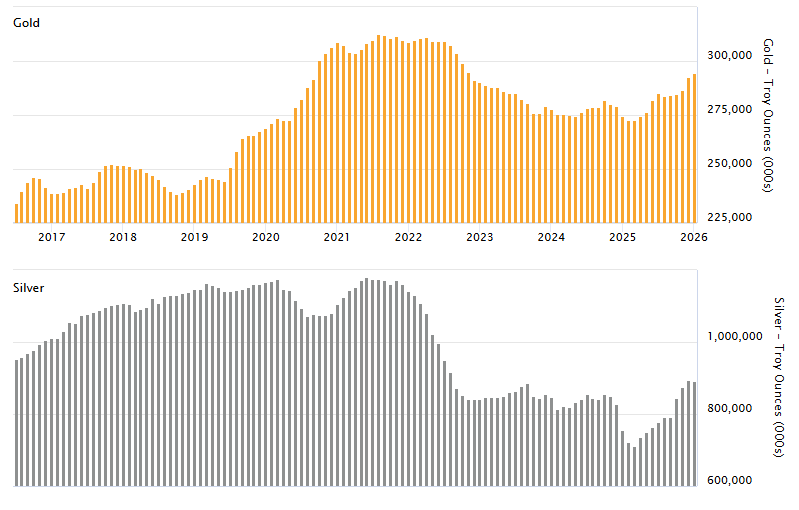
The LBMA publishes vault holdings data each month. As of the January 2026 report, there were also 27,729 tonnes of silver (a 0.3% decrease on the previous month), valued at $92 billion, which equates to approximately 924,304 silver bars.
COMEX provides leverage, speculative access, and price discovery. It is where macro funds, CTAs, and producers express directional views, hedge exposure, and trade volatility. The contract is highly financialised: less than 3% of open interest normally proceeds to delivery, yet the threat of delivery disciplines the entire curve.
The two venues are linked through EFP mechanisms, forward curves, and bullion-bank arbitrage desks. But unlike gold, where visible stocks exceed 200,000 tonnes, silver’s accessible float is narrower.
ETFs such as SLV and SIVR play an outsized role in silver. Their custody holdings often represent 30–40% of identifiable above-ground investment stocks, compared with roughly 10–12% for gold ETFs. Creation or redemption cycles of just 1,000 tonnes (barely a few weeks of mine output) can therefore swing lease rates by several percentage points and invert spot-futures spreads.
Notable Market Episodes

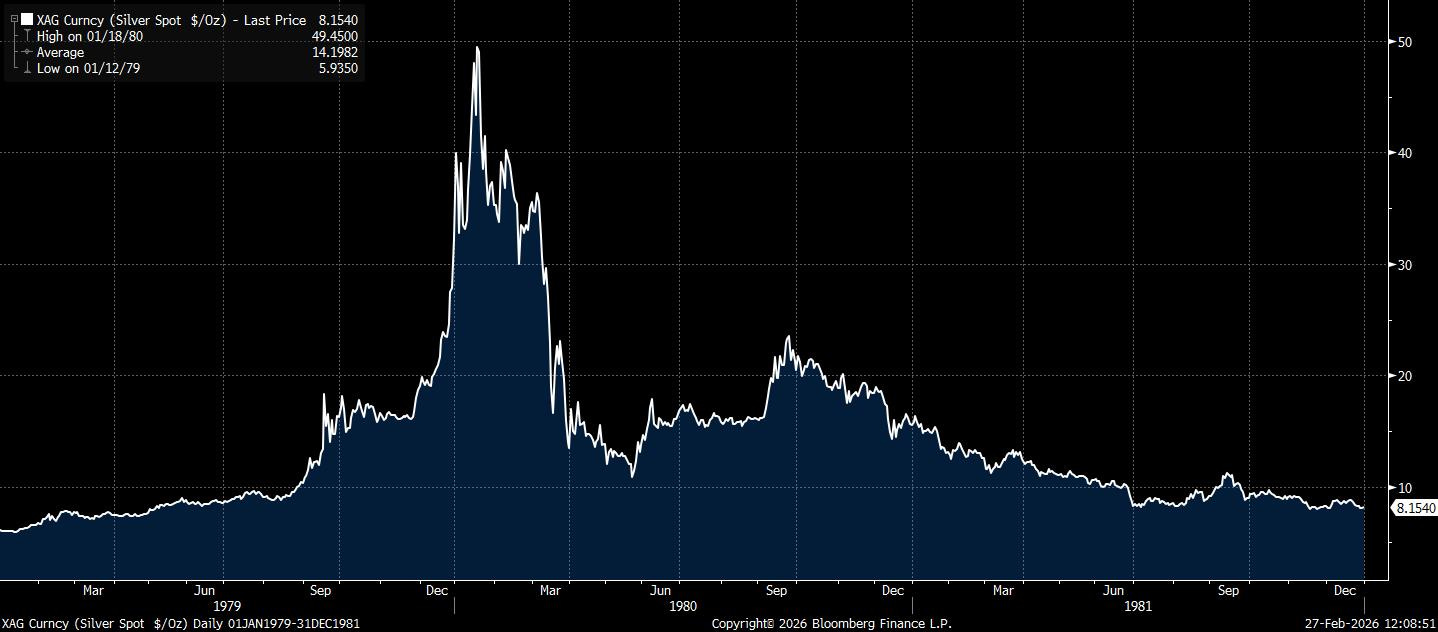
Silver’s modern history has been punctuated by episodes of concentrated speculation and abrupt reversals, underscoring its sensitivity to leverage, liquidity, and retail participation. The most infamous example occurred in 1979–1980, when the Hunt Brothers, Texas oil magnates, attempted to corner the silver market by amassing large physical holdings alongside heavily leveraged futures positions. Their aggressive accumulation drove prices from roughly $6 per ounce to nearly $50 in less than a year. The rally ultimately proved unstable. As volatility intensified, COMEX raised margin requirements and imposed position limits, effectively tightening financial conditions within the market. The resulting forced liquidations triggered a violent collapse, with prices falling back below $10. The episode remains a defining lesson in the dangers of leverage in relatively thin markets, where liquidity can evaporate quickly once policy or exchange rules shift.
Three decades later, silver again surged during the 2011 QE2-era precious metals boom. Fears of dollar debasement, inflation overshoot, and unconventional monetary policy attracted both institutional and retail inflows into precious metals. Silver, with its higher volatility and smaller market size relative to gold, reacted with exaggerated momentum. Prices climbed from approximately $18 to nearly $50 within months, revisiting levels last seen during the Hunt episode. However, once inflation concerns subsided and global liquidity conditions stabilised, speculative positioning unwound just as rapidly. The subsequent collapse reinforced silver’s reputation as gold’s higher-beta counterpart, capable of dramatic upside during macro stress, but prone to sharp reversals when conviction fades.
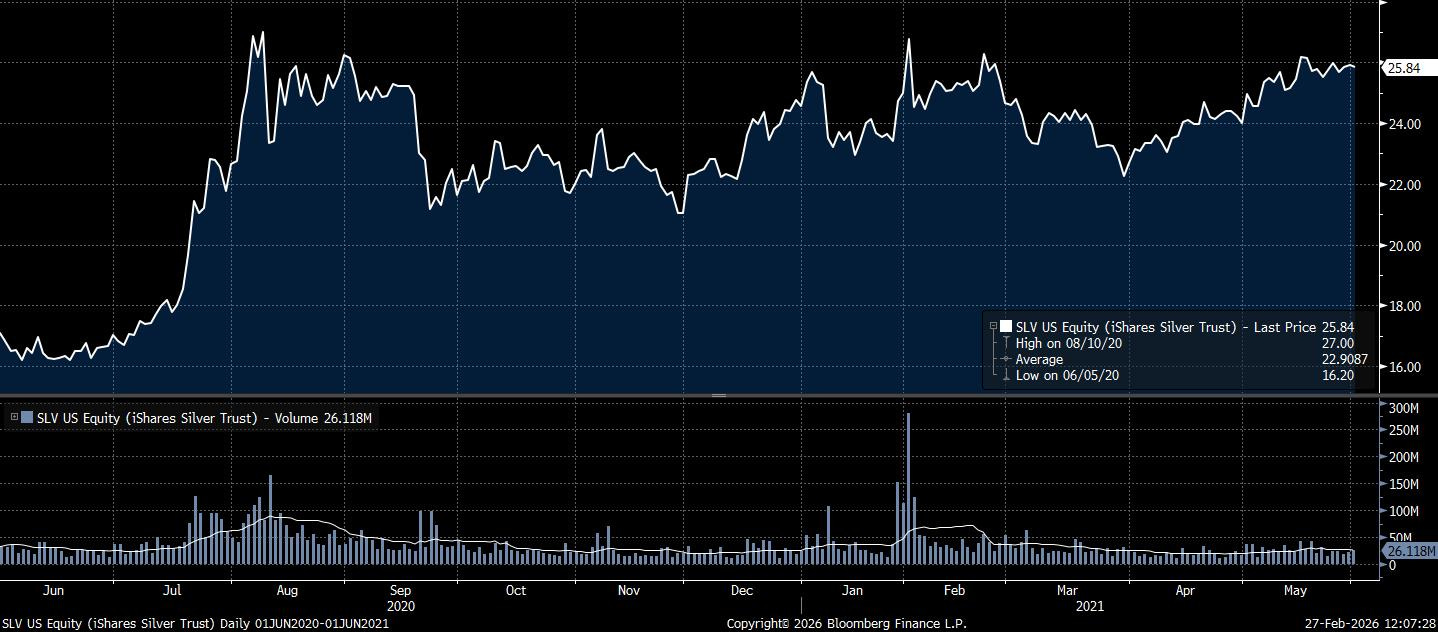
More recently, in early 2021, silver briefly became the focus of a coordinated retail-driven campaign inspired by the broader “meme stock” phenomenon. Retail traders mobilised through social media attempted to engineer a so-called “silver squeeze,” directing flows into physically backed ETFs and encouraging collective buying pressure. The episode produced a short-lived price spike and record trading volumes in vehicles such as SLV. However, unlike in equities, where short interest can create mechanical squeeze dynamics, silver’s deep institutional liquidity and global OTC market absorbed the flows without triggering sustained physical bottlenecks. Prices quickly retraced as speculative enthusiasm waned, illustrating once again that while silver can respond violently to concentrated positioning, structural market depth ultimately constrains attempts to force prolonged dislocations.
2025/26 - Present
The January 2026 episode belongs in the same lineage as 1980 and 2011, but it was not driven by a new macro narrative. It was the moment when already-tight physical conditions collided with an overcrowded financial expression of that thesis.
By late 2025, the market had largely accepted the structural deficit story. What changed into year-end was positioning. Investors increasingly treated silver not as a slow-moving industrial theme but as a momentum trade built on genuine scarcity. ETF accumulation, derivatives exposure, and retail participation pulled incremental metal out of circulation while simultaneously increasing the volume of paper claims against it. The tradable float was shrinking as leverage was rising.
The final phase of the rally showed the classic characteristics of a late-cycle squeeze. Derivatives activity surged in the last week of January 2026, with exchange data showing exceptionally heavy futures and options turnover, consistent with concentrated speculative positioning. Prices accelerated vertically, culminating in an all-time high near $120.6/oz on January 29th.
What followed was not a reassessment of solar demand, mine supply, or long-term scarcity. It was a balance-sheet event.
On January 30th, silver fell roughly 25–31% in a single session, one of the largest daily declines since 1980, while ETF proxies recorded collapses of similar magnitude on extreme volume. The trigger was a rapid tightening of financial conditions inside the market itself. As volatility surged, CME raised margin requirements under a revised methodology, forcing leveraged participants to post collateral or reduce exposure.
In a market with limited depth, that shift flipped the reflexivity. The same leverage that had amplified the rally now accelerated liquidation. Selling pressure became mechanical rather than discretionary, producing a non-linear air pocket characteristic of silver’s most violent historical reversals.
Importantly, the structural backdrop did not disappear. Data continued to show persistent deficits and strong industrial demand even as prices corrected. What the episode demonstrated instead was how quickly silver can transition from a fundamentals-led bull market to a liquidity-driven unwind once positioning saturates.
If the 2025 move was about scarcity, the January 2026 move was leverage discovering that scarcity is not the same thing as liquidity.
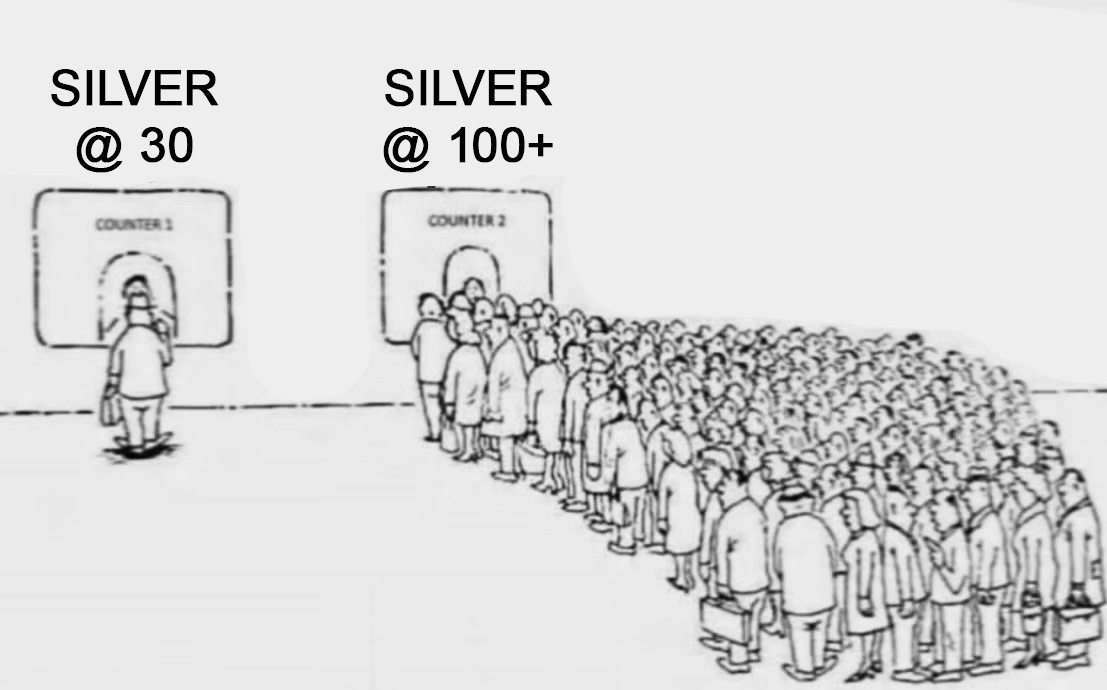
We had the following film play out, but in the metals market…

Trading Strategies
Spot vs ETF Exposure
If the objective is long-term, unlevered exposure, spot remains the most direct route. An investor can access this primarily through the London OTC market.
Trading spot silver typically involves transacting bilaterally with a bank or bullion dealer, with settlement on a T+2 basis. On settlement, cash is exchanged for a silver position credited to a metal account. That account can be held on an unallocated basis, representing a general claim on metal within the dealer’s vaulting system, or on an allocated basis, where specific LBMA-approved bars are set aside in the investor’s name, with serial numbers recorded and custody fees charged.
From there, the position can be held outright, leased into the market, rolled into forwards or swaps, or converted into physical delivery. For participants with access, this is the cleanest way to engage directly with the underlying bullion market.
For many investors, however, ETFs such as SLV provide a more accessible alternative. These trade on equity exchanges, clear through standard securities infrastructure, and offer intraday liquidity without the operational complexity of bullion accounts. While ETFs lack some of the flexibility of the OTC market, they are often the most practical solution for smaller ticket sizes or for accounts without access to London metals desks.
Spot XAG/USD can also be attractive where available because it trades like a currency pair, offering near-continuous liquidity and tight execution. That said, there are clear reasons why spot or ETFs may not be appropriate:
Full notional must be funded, limiting capital efficiency
Shorting is operationally and economically more complex
The exposure may need to be future-dated or aligned to another portfolio hedge
In those cases, an investor typically moves into derivatives, such as futures and forwards.
Futures vs Forwards
Silver exposure can be expressed through OTC forwards or exchange-traded COMEX futures. Both introduce leverage, simplify short positioning, and allow exposures to be tailored to specific horizons.
Forwards are negotiated bilaterally, typically out of London, and are fully customisable by size and maturity. Crucially, they embed physical-market dynamics, including lease rates and inventory conditions. When the trade thesis is tied to physical tightness or carry, this matters.
A live example is the recent backwardation in London silver, where spot has traded above forward prices. Silver normally trades in contango due to storage and financing costs. Backwardation reflects near-term scarcity.
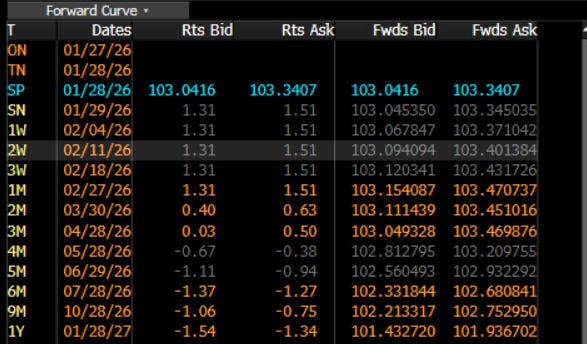
In such an environment, a trader does not need a directional view on silver to express a thesis. Selling spot and buying a six-month forward is a way to position for a normalisation of the curve as tightness eases and lease rates fall. The P&L is driven by curve dynamics rather than outright price. That said, forwards are not guaranteed to converge smoothly, and access remains largely institutional.
For most tactical applications, COMEX futures are the more practical tool. They are standardised, centrally cleared, and highly liquid across benchmark maturities. Margining allows for capital-efficient positioning, and the contract suite now supports much finer sizing.
The introduction of the CME 100-ounce silver futures contract has been particularly important, materially lowering the notional barrier to entry versus the legacy 5,000-ounce contract and improving execution flexibility for active traders.
Options Strategies
There are periods when neither spot nor linear derivatives are the right tool. When the objective is defined risk, volatility exposure, or event-driven positioning, we move into options.
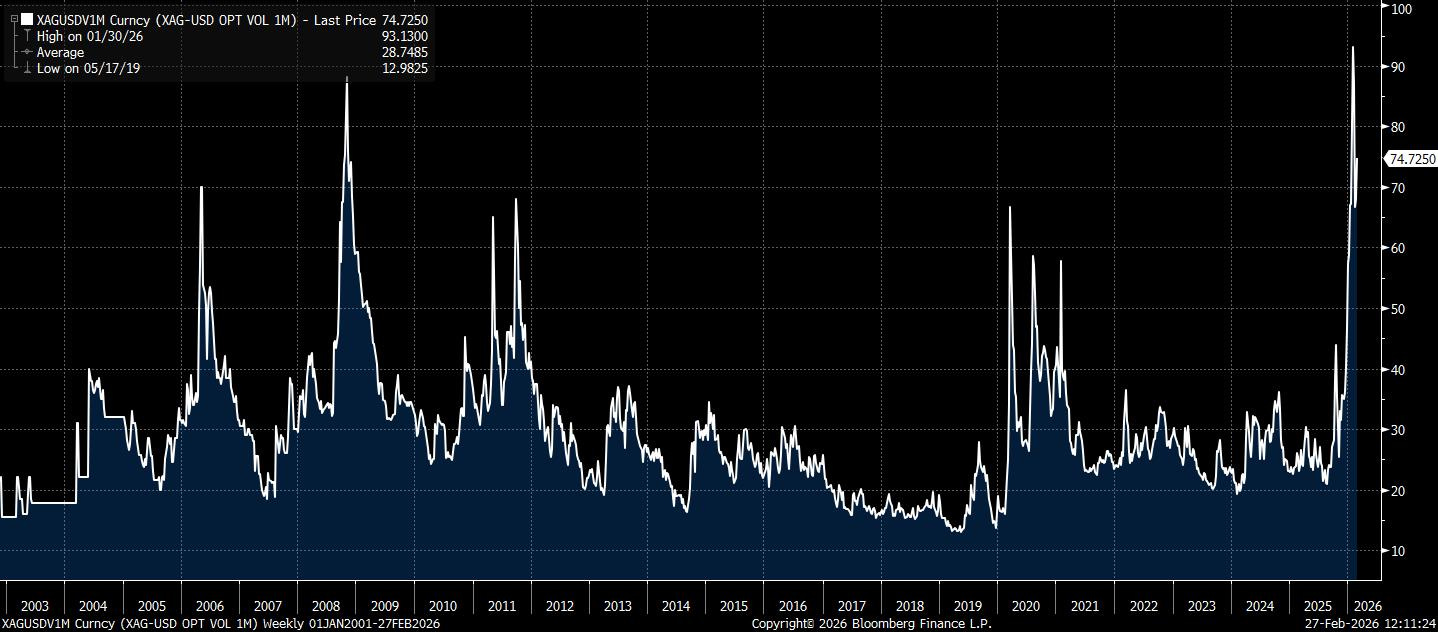
Silver options are where the market’s character is most visible. Implied one-month volatility recently broke to multi-decade highs, reflecting expectations of large and potentially disorderly price swings.
At those times, price-agnostic structures often dominate. Calls and puts can be used to express long or short volatility views, while spreads and convex structures can be built to shape asymmetry. Around discrete catalysts such as central bank meetings, macro releases, or geopolitical risk, straddles and strangles allow positioning for movement rather than direction.
For more advanced implementations, skew becomes a tradable variable. Relative pricing between calls and puts often reflects embedded positioning or hedging demand. In our experience, distortions in skew can at times be isolated and traded independently of outright direction.
When silver is being treated primarily as a volatility instrument rather than a price instrument, options tend to dominate.
Relative-Value Structures
There are also periods when an investor may not want outright silver exposure at all. Some of the most consistent strategies in the precious-metals space have been relative-value trades.
The gold–silver ratio remains the most common framework. Rather than forecasting absolute levels, the trade is structured around the relationship between monetary and industrial metals. Extreme readings often coincide with macro dislocations, positioning imbalances, or shifts in demand regimes.
A typical implementation is via paired COMEX futures positions: going long silver and short gold when the ratio is elevated and silver appears undervalued, and reversing the structure when the ratio compresses. This approach neutralises much of the shared dollar and real-rate sensitivity, allowing returns to be driven primarily by relative repricing.
Silver Equities
Primary silver miners and streaming companies provide a levered and operationally sensitive way to express silver views.
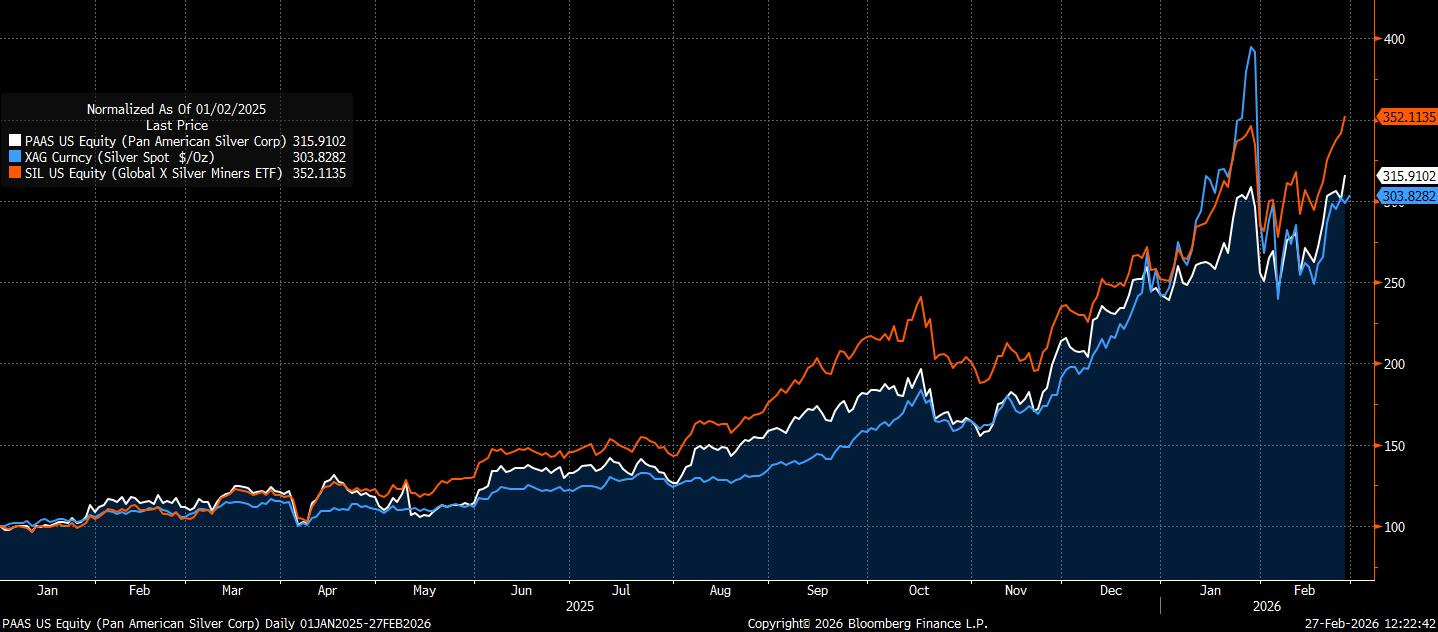
The benefit of trading single-name equities is the operational leverage gained from higher commodity prices. The company benefits from the elevated selling price almost immediately, while incremental extraction costs increase at nowhere near the same pace in the short run.
A good example is Pan American Silver Corp (PAAS), which is owned in our Master Fund and is up 180% over the past year.
Market Participants
Primary Producers
Mining companies represent the natural structural shorts in silver. Their objective is revenue stability rather than directional price exposure, and this distinction shapes how they interact with the market.
Because a large share of global silver output is produced as a byproduct of other metals, hedging decisions are often balance-sheet driven rather than price-driven.
Producers tend to increase forward sales when prices rise, when leverage increases, or when lenders demand risk management discipline during capex cycles. This flow profile makes producer activity procyclical. They sell strength and reduce hedges into weakness, which rarely determines trend direction but frequently influences trend velocity by supplying liquidity into rallies and withdrawing it during drawdowns.
Industrial Users/Fabricators
Industrial consumers form the structural long base of the silver market because they rely on the metal as a production input.
Their participation is motivated by cost control rather than return generation, and their hedging behaviour reflects procurement discipline rather than speculative intent.
Fabricators typically layer hedges over time and increase activity after price rallies, when procurement risk becomes more visible to management. Conversely, they tend to step back during declines and rely on spot purchasing.
Industrial demand therefore anchors long-run price floors while remaining largely irrelevant for short-term price discovery.
Bullion Banks/Cap Markets Desks
Bullion banks function as the core transmission mechanism of the silver market. They intermediate nearly all OTC flow, warehouse risk, structure derivatives, and arbitrage price differences across spot, forwards, futures, and leasing markets.
Dealer balance sheet capacity is a first-order determinant of liquidity. When risk appetite is strong and balance sheets are elastic, spreads tighten and markets absorb flow efficiently. When constraints bind, liquidity deteriorates quickly and price movements can become discontinuous.
Lease rates in particular provide insight into physical tightness and dealer funding stress, making them an underutilised signal for institutional investors monitoring market conditions.
Fund/Asset Managers
Institutional capital accesses silver primarily through futures, ETFs, and structured products, and it is this cohort that most often determines the marginal price.
Unlike producers or industrial users, these participants are explicitly return-seeking and frequently momentum-sensitive. Macro funds and commodity index vehicles all interact with the market through rule-based or macro-driven positioning frameworks.
Because silver’s market depth is thinner than gold’s, reallocations by large funds can produce outsized price reactions relative to flow size. ETF flows are especially powerful because physically backed vehicles must acquire or sell metal to match share creation or redemption. As a result, institutional positioning frequently amplifies trends rather than dampening them.
Retail Investors
Silver has historically attracted disproportionate retail participation compared with other metals. Its lower nominal price per ounce creates a perception of accessibility that draws individual investors into coins, small bars, leveraged derivatives, and short-dated options.
Retail participation tends to surge during periods of macro anxiety, currency debasement narratives, or viral social media attention. While individually small, retail traders can collectively influence price during liquidity-thin periods, particularly in derivatives markets where leverage magnifies impact.
Sovereigns/Central Banks
Central banks play only a minor direct role in silver markets, in contrast to their structural importance in gold. Official holdings are limited, and transactions are infrequent, which removes a stabilising demand base that might otherwise dampen cycles.
Conclusion
Silver is not one market. It is a stack of markets layered on top of each other (physical, financial, industrial, monetary), each governed by different participants, constraints, and reflex loops.
That structural complexity is why silver repeatedly confounds linear frameworks. Analysts who treat it as a simple commodity underestimate its financing channel. Those who treat it as a monetary metal miss its fabrication cycle. And those who view it purely through the lens of positioning risk, overlooking the physical plumbing that ultimately enforces delivery discipline.
If you enjoyed this Primer, please drop a like or comment below. If you want to read more Primers, check out the library here.
AP
Amazing, thanks for the primer, appreciate the nuanced approach and the "stacked market" analogy. I think many people are unclear that unlike Gold outside jewelry & coins, Silver does on top of those have industrial application demand that can be pretty fluctuating.
To call the COMEX/LME as a stability/trust anchor, I'd have my doubts about them in light of the most recent two "outages" though.
I'd say China and India seem to be willing to clamp down harder on a lot of synthetic shorts/longs while London / NYC kind of seem to overheat their servers a lot lately? Raising margin requirements is one thing, but then going dark during main trading windows seems not very reliable for a commodities exchange and opens them to (rightful) criticism and doubt.
I think all the puns about "hot commodities & running it hot" must have been made at their expense by now.
Excellent primer on Silver and much appreciated. Great work.