

Volatility is the price of uncertainty. But in modern markets, it’s not just a consequence, it’s a product.
From VIX to MOVE to CVIX, volatility indices and derivatives sit at the crossroads of risk pricing, macro signals, and trading opportunities. They’re also some of the most misunderstood tools in the global financial toolkit. This primer demystifies the key players in the volatility space and lays out how traders, hedgers, and macro investors use them.
This primer runs through:
- How to measure volatility
- Key volatility indices
- Major historical events
- How to use volatility products
- Key participants in the ecosystem

Measuring Volatility
Before we get into specific gauges, consider the two forms of volatility that are generally relevant for investors.
Realised Volatility (RV)
This is a backwards-looking measure of how much an asset’s price actually moved over a past period (e.g., last 10, 30, or 90 days). It’s calculated directly from historical price data
How it’s calculated:
Take historical prices (usually daily closes).
Calculate daily returns (Rt):
Rt =ln (Pt / Pt−1)
Square each return (to remove direction).
Average them over the lookback window.
Take the square root and annualise (multiply by √252 for daily data).
Example: If the standard deviation of daily returns is 1%, the annualised realised vol is:
0.01 × 252 ≈ 15.9%
The key point is that RV is observable, but it’s about the past, not what traders expect next.
Implied Volatility (IV)
This is a forward-looking measure—the level of volatility the options market is pricing in for the future. It’s backed out from option prices using an options pricing model like Black-Scholes.
Let’s say you get a price from a market maker for an option. From the price, you can strip out elements that you already know that go some way to making up the price, such as the current underlying price, the strike level, the time to expiry, etc. By removing all of these, you can solve for the only unknown—implied volatility.
It’s the IV pulled from option prices that form the base when trying to quantify volatility for the future.
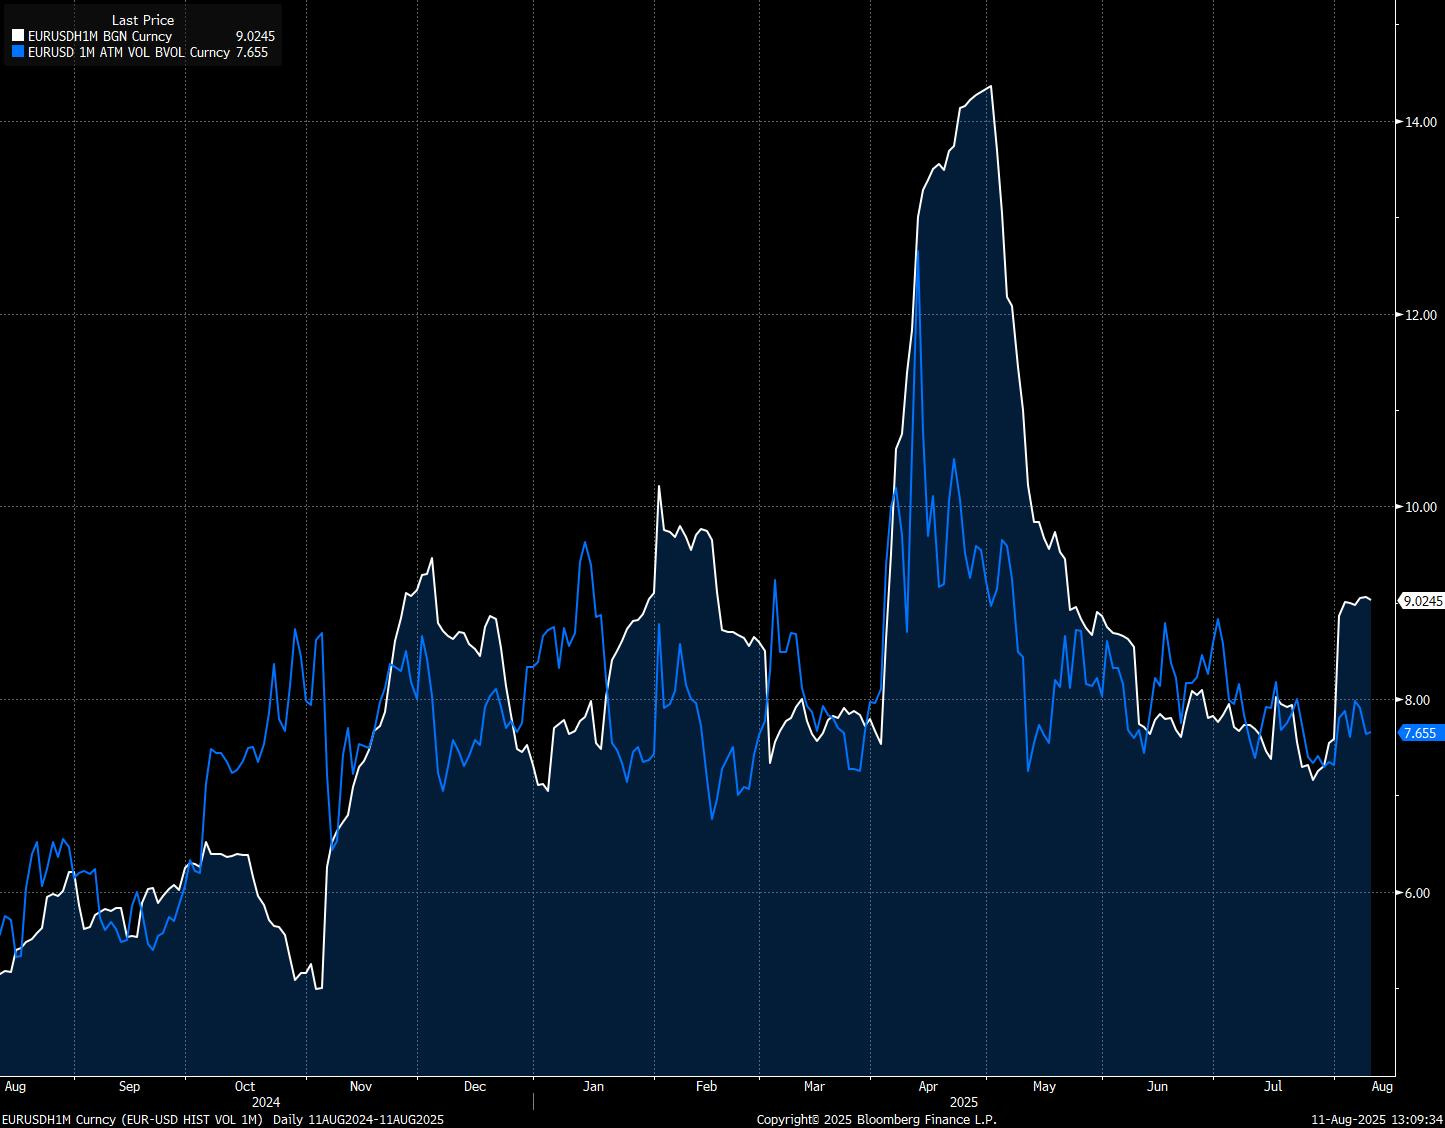
Below is an example for EUR/USD, showing the one-month historical vol compared to the one-month implied vol:
Volatility Gauges
The VIX: Equity Volatility’s Global Poster Child
What it is: The VIX is a model-derived measure of expected 30-day S&P 500 volatility, calculated from out-of-the-money SPX options. It’s quoted as a single number, but it’s not a dollar price; rather, a volatility percentage. The figure is in annualised percentage points, which you can convert to the implied one-month equivalent (e.g., VIX at 20 = implied 1-month SPX vol of ~5.8%).
How it works: Rather than tracking realised volatility, the VIX uses a weighted strip of SPX options to interpolate expected variance. It’s a forward-looking proxy for how much turbulence markets are pricing in.
Why it matters: The VIX reflects not just hedging demand, but also liquidity, positioning, and the cost of convexity. It’s also the backbone of a suite of ETPs and derivatives, from VIX futures to inverse vol ETFs.

The MOVE: Treasury Volatility’s Revival Signal
What it is: The MOVE Index (Merrill Option Volatility Estimate) is the bond market’s equivalent of the VIX. It measures the implied volatility of 1-month Treasury options across 2y, 5y, 10y, and 30y tenors, weighted to reflect market impact.
Why it matters: MOVE spikes often precede or coincide with funding stress, policy surprises, or convexity hedging cascades. In a world where macro risk increasingly lives in fixed income, MOVE is a critical signal of systemic stress.
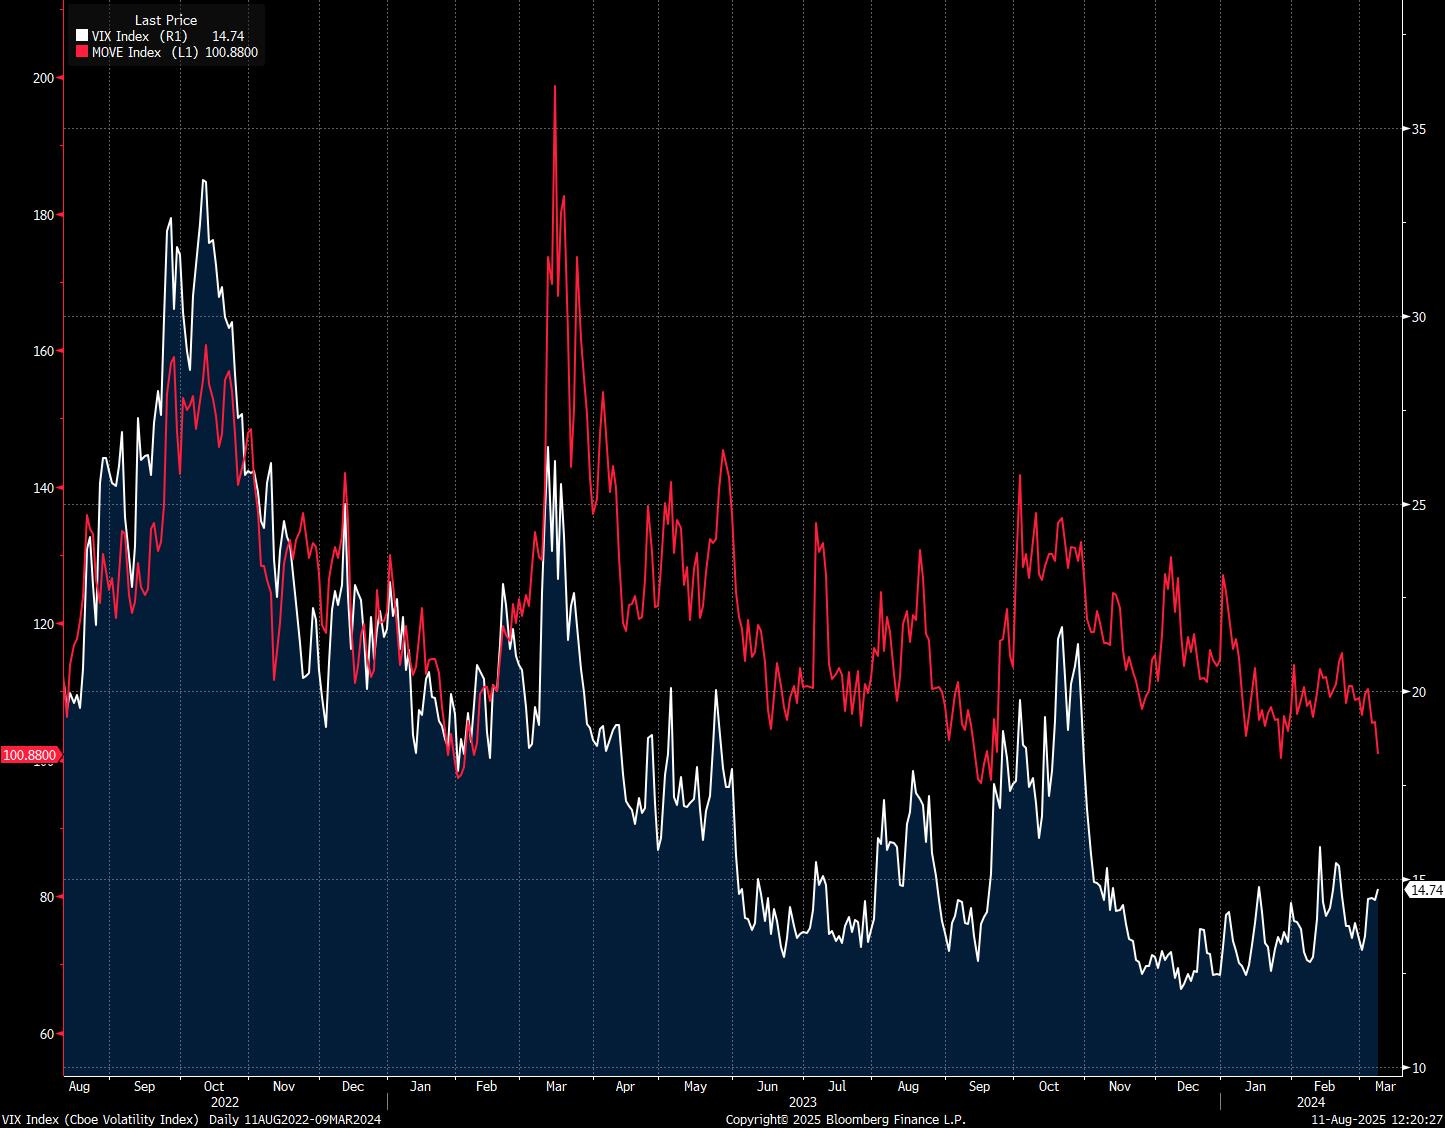
Relationship to VIX: Historically, MOVE and VIX were positively correlated. Post-GFC, that relationship broke down. In 2023–2024, MOVE surged while the VIX stayed muted—a regime defined by bond volatility without equity panic.
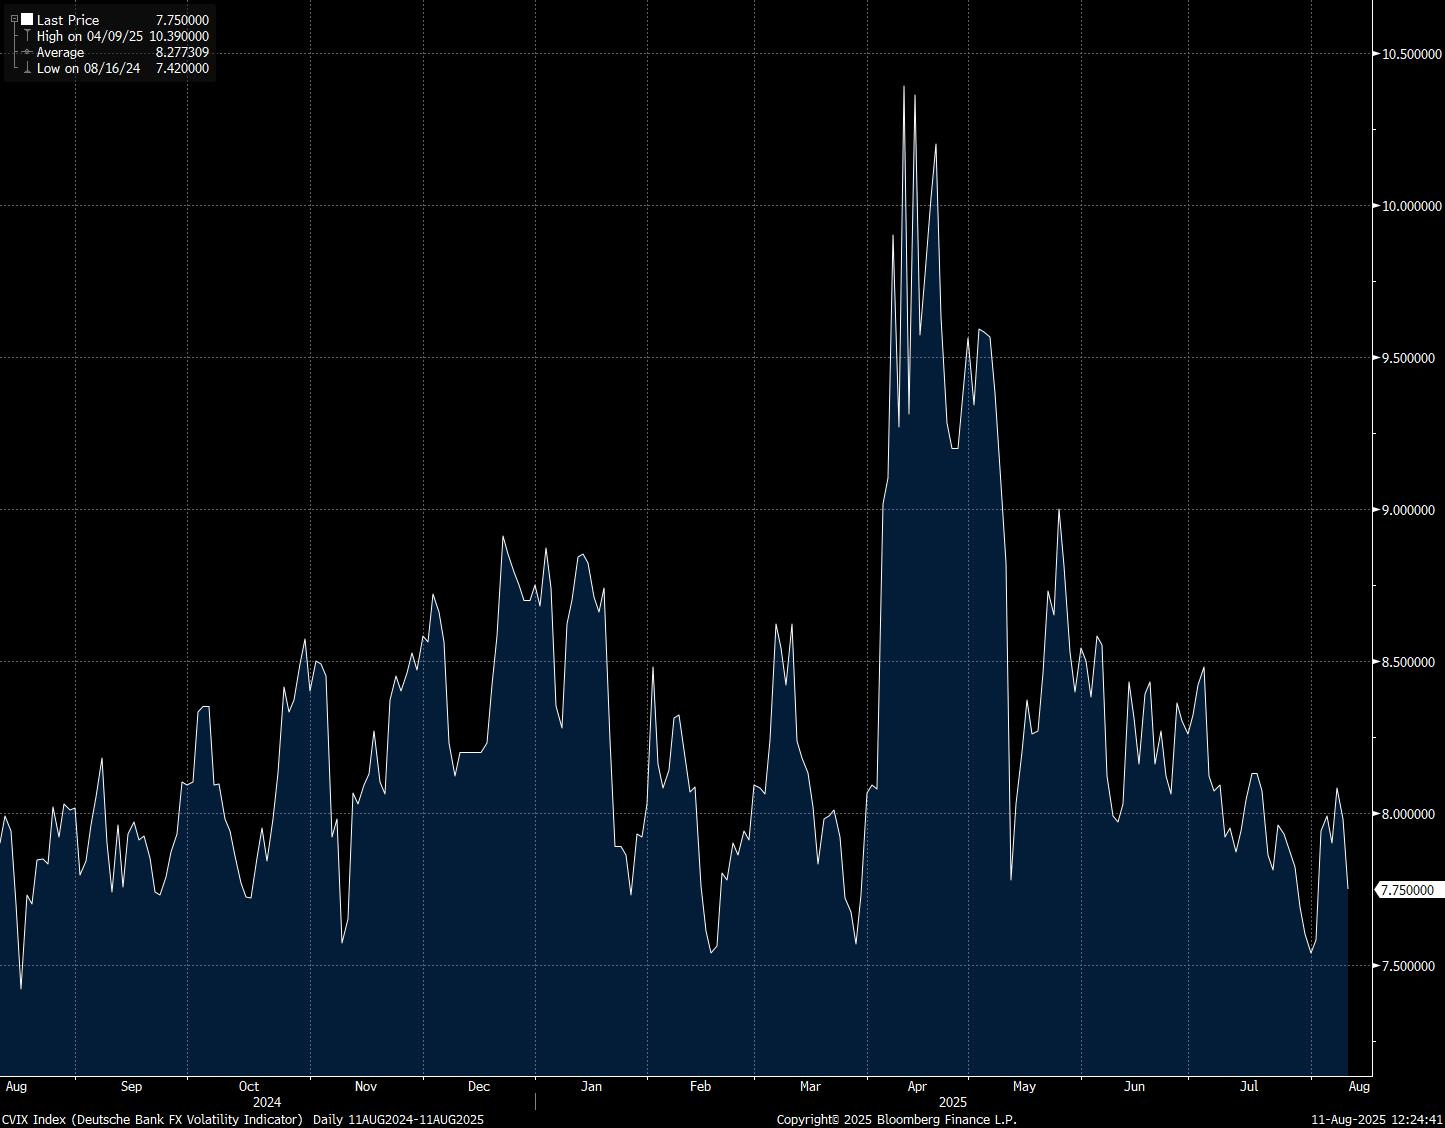
The CVIX: Currency Volatility’s Black Box
What it is: CVIX refers to the Deutsche Bank FX Volatility indicator. It’s a synthetic index created by DB to track implied volatility in G10 foreign exchange markets. It takes 1-month at-the-money implied volatilities from FX options across a basket of liquid G10 currency pairs. Each pair is weighted by its global trading volume and liquidity so that bigger pairs (EUR/USD, USD/JPY) have more influence. The individual vols are then combined into a single, trade-weighted average, producing one daily number.
Why it’s underfollowed: CVIX gets less attention due to decentralisation. No single currency “index” defines the space. But for global macro traders, implied FX vol is often the cleanest expression of regime shifts, especially in EM.
Why it matters: FX vol is sensitive to interest rate differentials, central bank divergence, and geopolitical shocks. When FX vol jumps, it often signals cross-asset contagion brewing under the surface.
Key Historical Events: When Volatility Spoke Loudest
2008, GFC
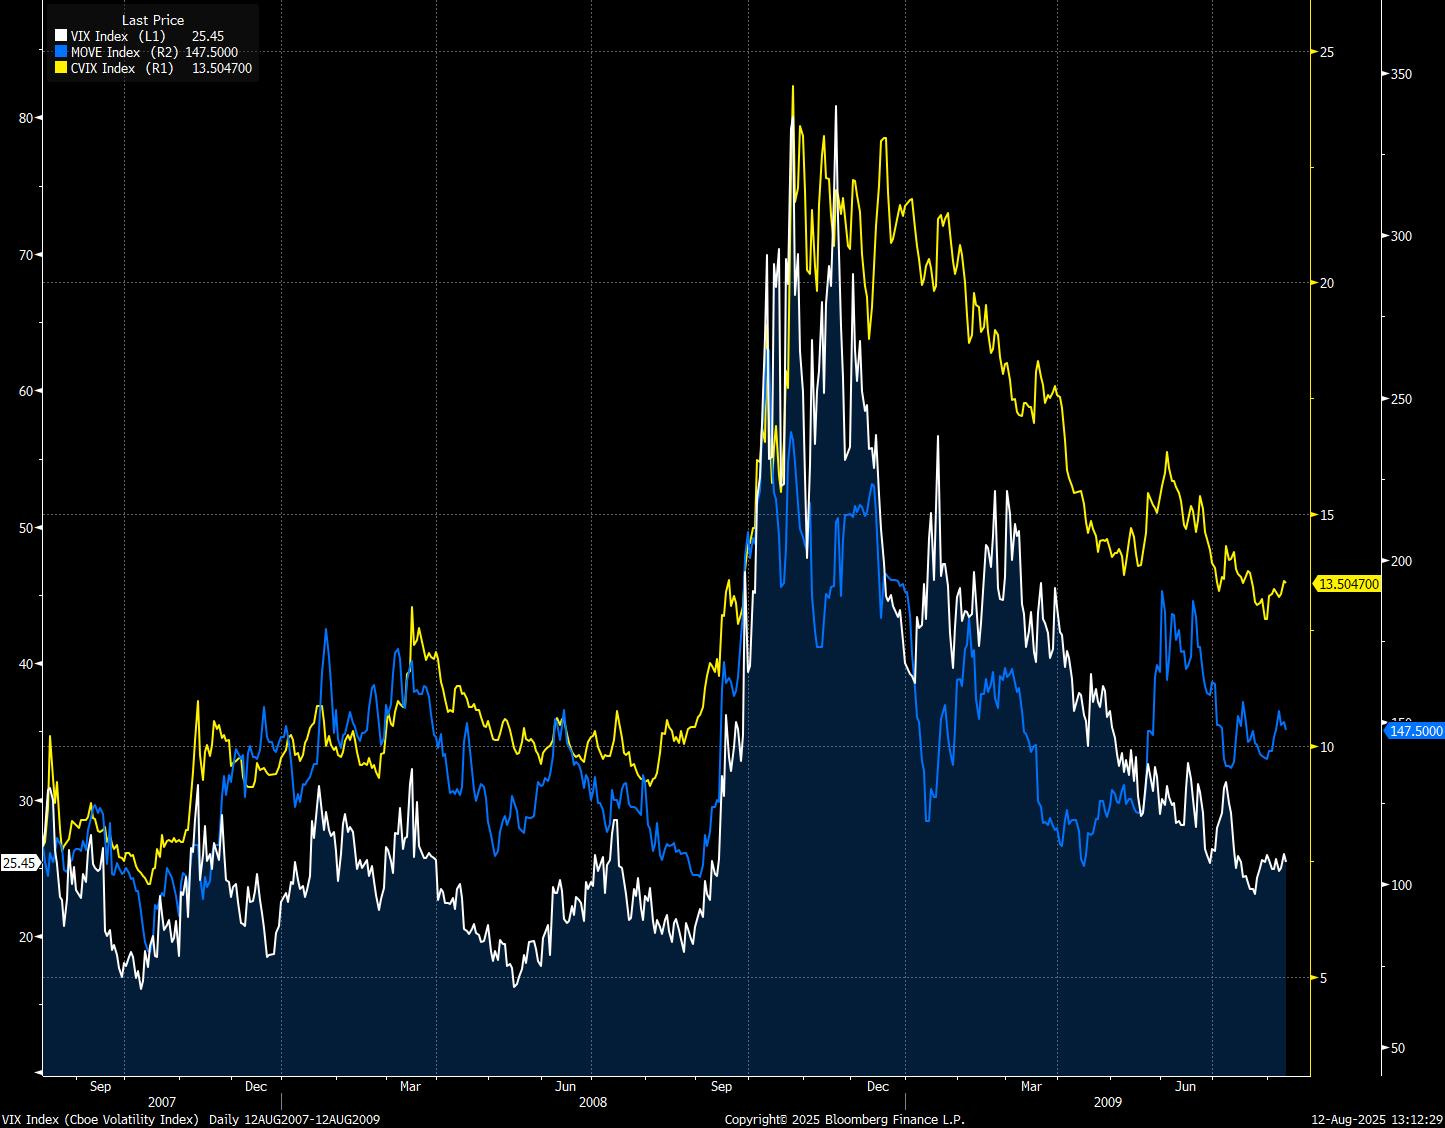
During the Global Financial Crisis (GFC), volatility surged, with the VIX and MOVE registering some of their highest readings on record. The VIX spiked to an intraday high of 89.53 on October 24, 2008, and closed as high as 80.86 on November 20, 2008. That was nearly triple its 2007 average level of 17.5, underscoring the scale of equity-market panic.
The MOVE index followed a similar trajectory in the rates market, climbing from a pre-crisis low near 51 in May 2007 to a historic high around 264 in October 2008. This reflected extraordinary uncertainty around interest rates, credit conditions, and liquidity.
2013, Taper Tantrum
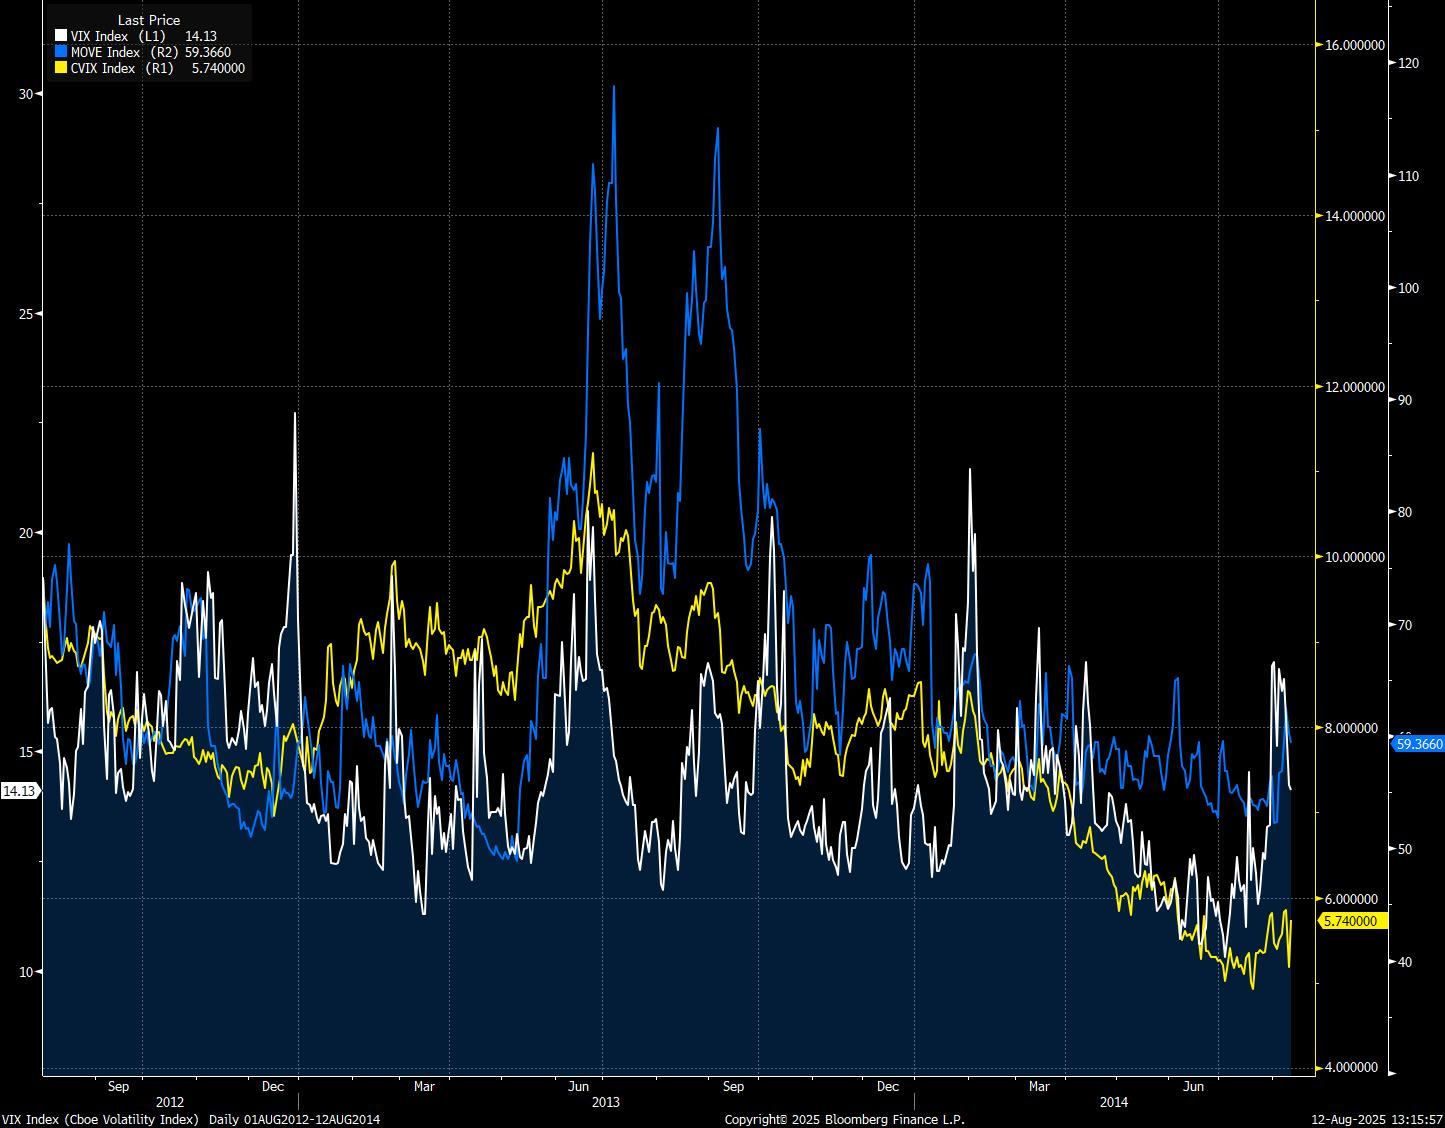
During the 2013 taper tantrum, market volatility followed a markedly different pattern than in more acute crises.
Equity-market fears, measured by the VIX, rose only modestly. In fact, the VIX remained generally below 20 throughout May‑July 2013—even as Fed tapering loomed—indicating that equity volatility stayed relatively contained.
Meanwhile, uncertainty rippled across emerging markets rather than US equities. After Federal Reserve Chairman Ben Bernanke hinted at scaling back QE in May 2013, emerging-market assets faced sharp corrections: exchange rates and stock indices tumbled, and bond yields and risk premiums widened substantially.
Within weeks, the S&P 500 dropped around 8%, world stock indices fell by nearly 10%, and EM currencies and equities declined by approximately 5% and 15%, respectively; at the same time, the U.S. 10‑year Treasury yield surged from around 2% to roughly 3%.
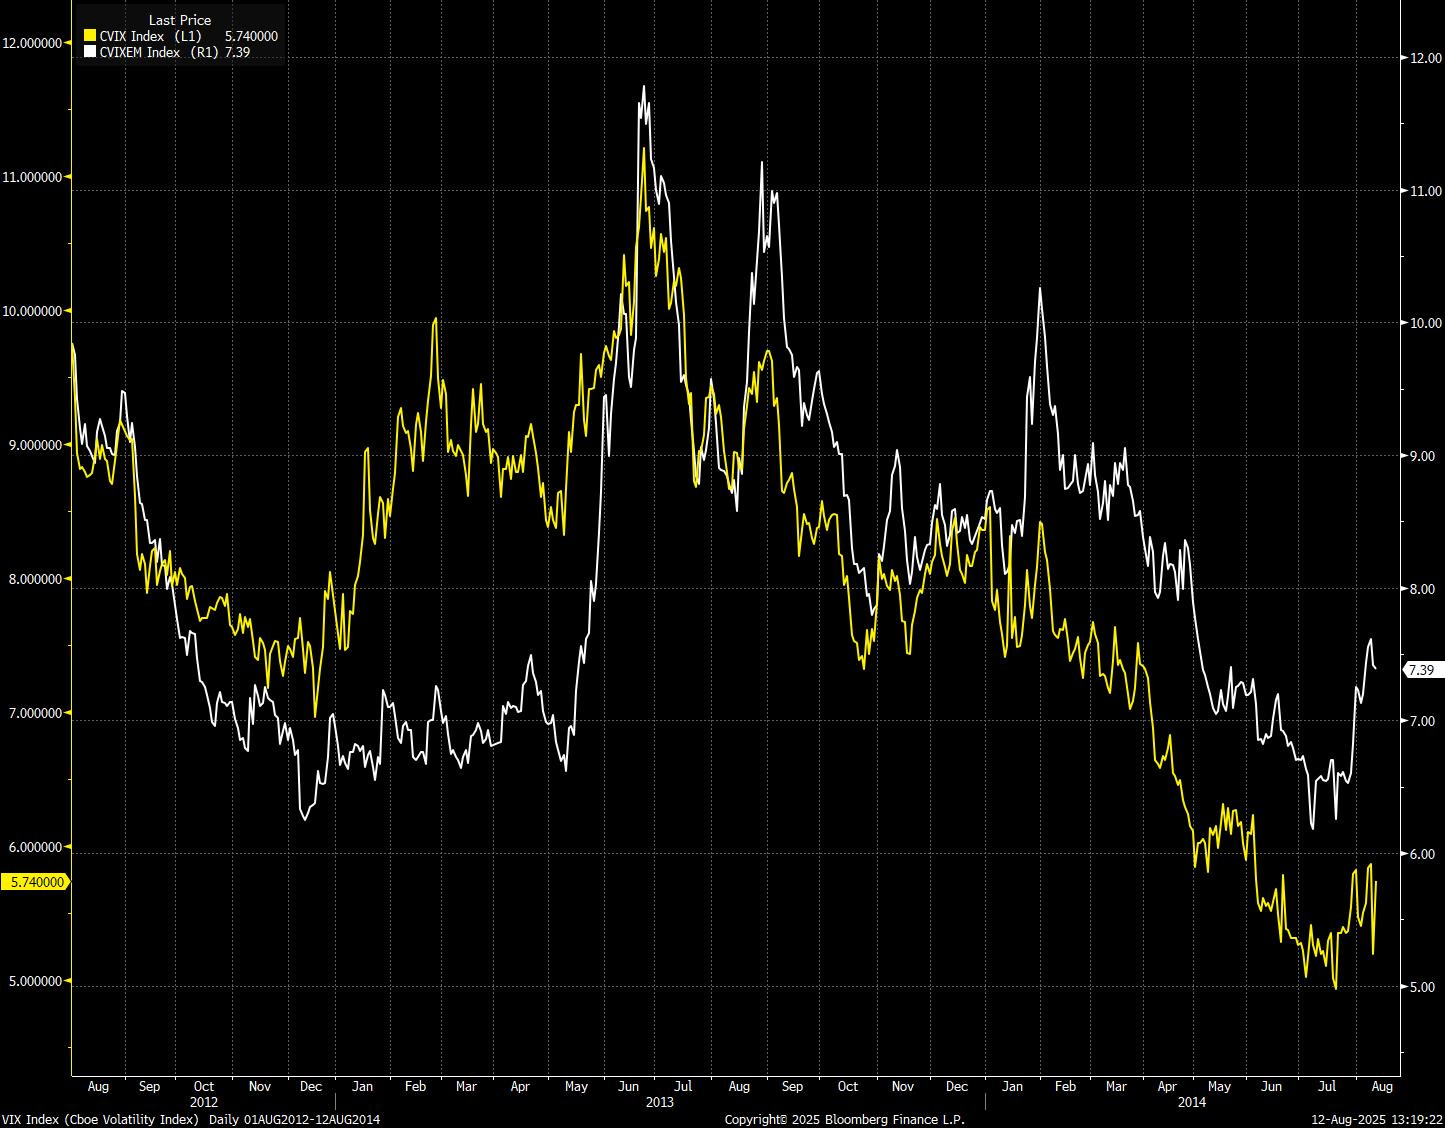
While equity volatility stayed muted, the MOVE index surged. Even though the CVIX only rallied modestly, the emerging market FX equivalent gauge saw an outsized move, as shown below:
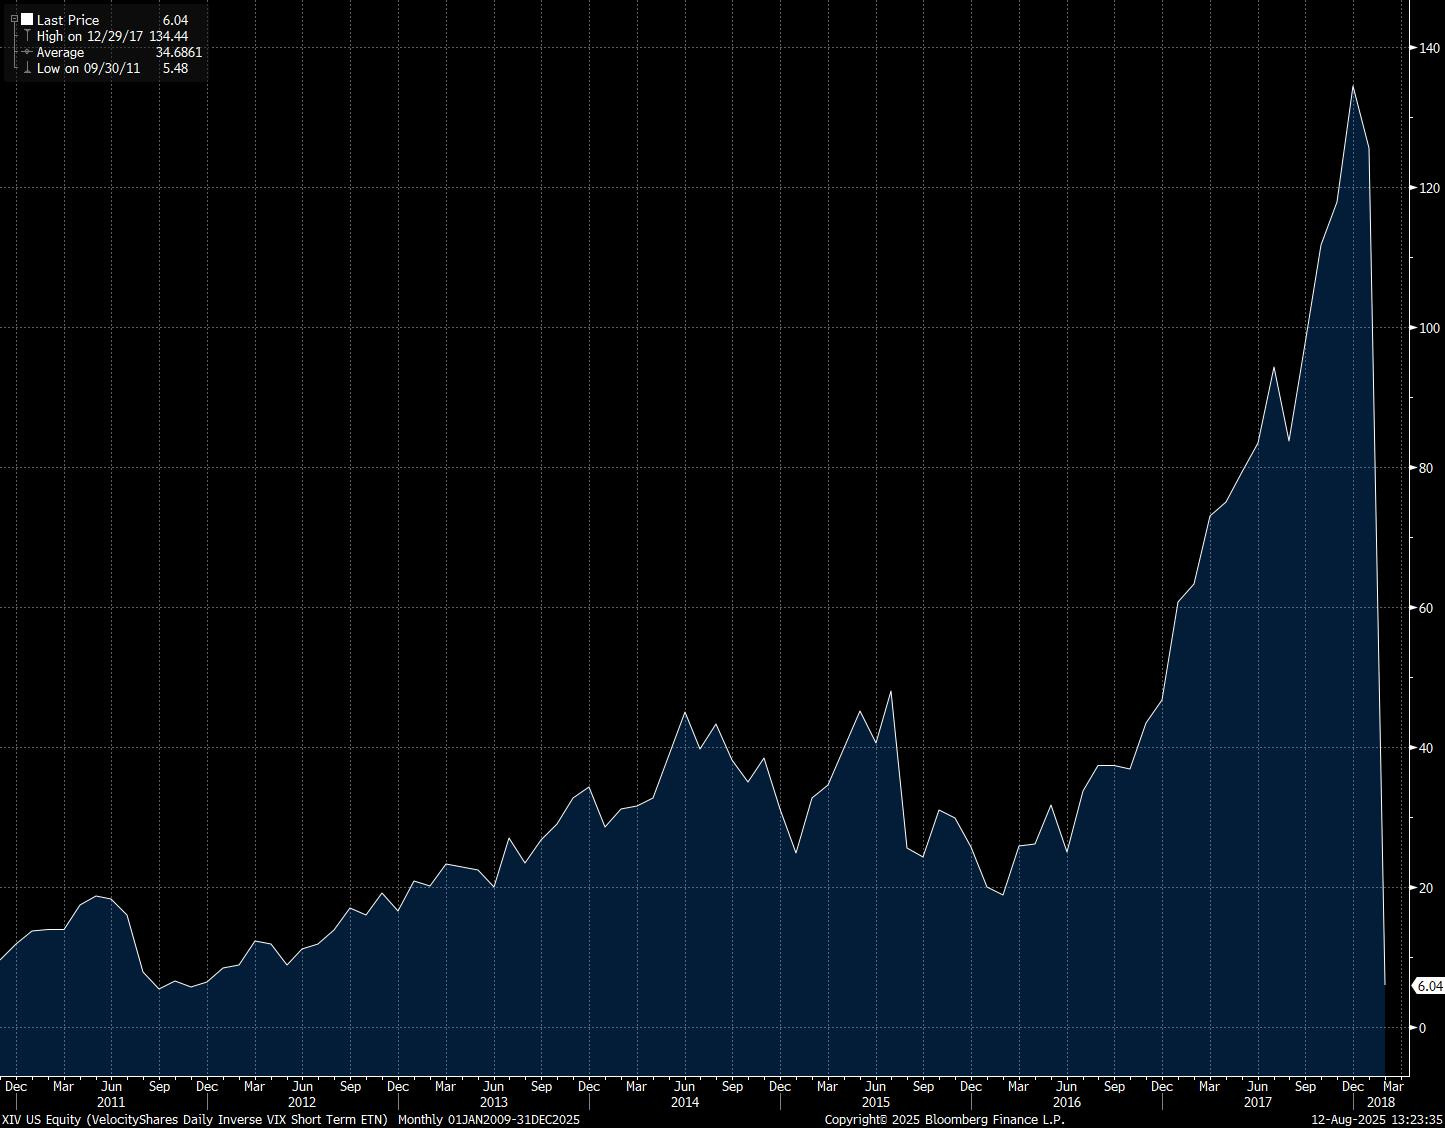
2018, Volmageddon
Volmageddon in February 2018 was triggered by a violent unwind of the short-volatility trade that had flourished during the unusually calm markets of 2017. For most of that year, equity volatility was historically low, with the VIX spending months in single digits. This lulled investors into selling volatility—both directly, through shorting VIX futures, and indirectly, through inverse-VIX exchange-traded products (ETPs) like XIV and SVXY—to capture steady premium income.
The spark came on February 5, 2018, when U.S. equities suffered a sharp drop: the S&P 500 fell nearly 4% in a single session, its largest daily decline since 2011. As the market fell, the VIX more than doubled—its biggest single-day percentage jump on record—moving from around 17 to above 37. That spike in implied volatility caused massive mark-to-market losses for short-volatility positions. For inverse-VIX ETPs, the problem was structural: their daily rebalancing meant they had to buy VIX futures into a volatility spike to maintain exposure. This created a feedback loop—forced buying of VIX futures drove volatility even higher, which in turn forced more buying.
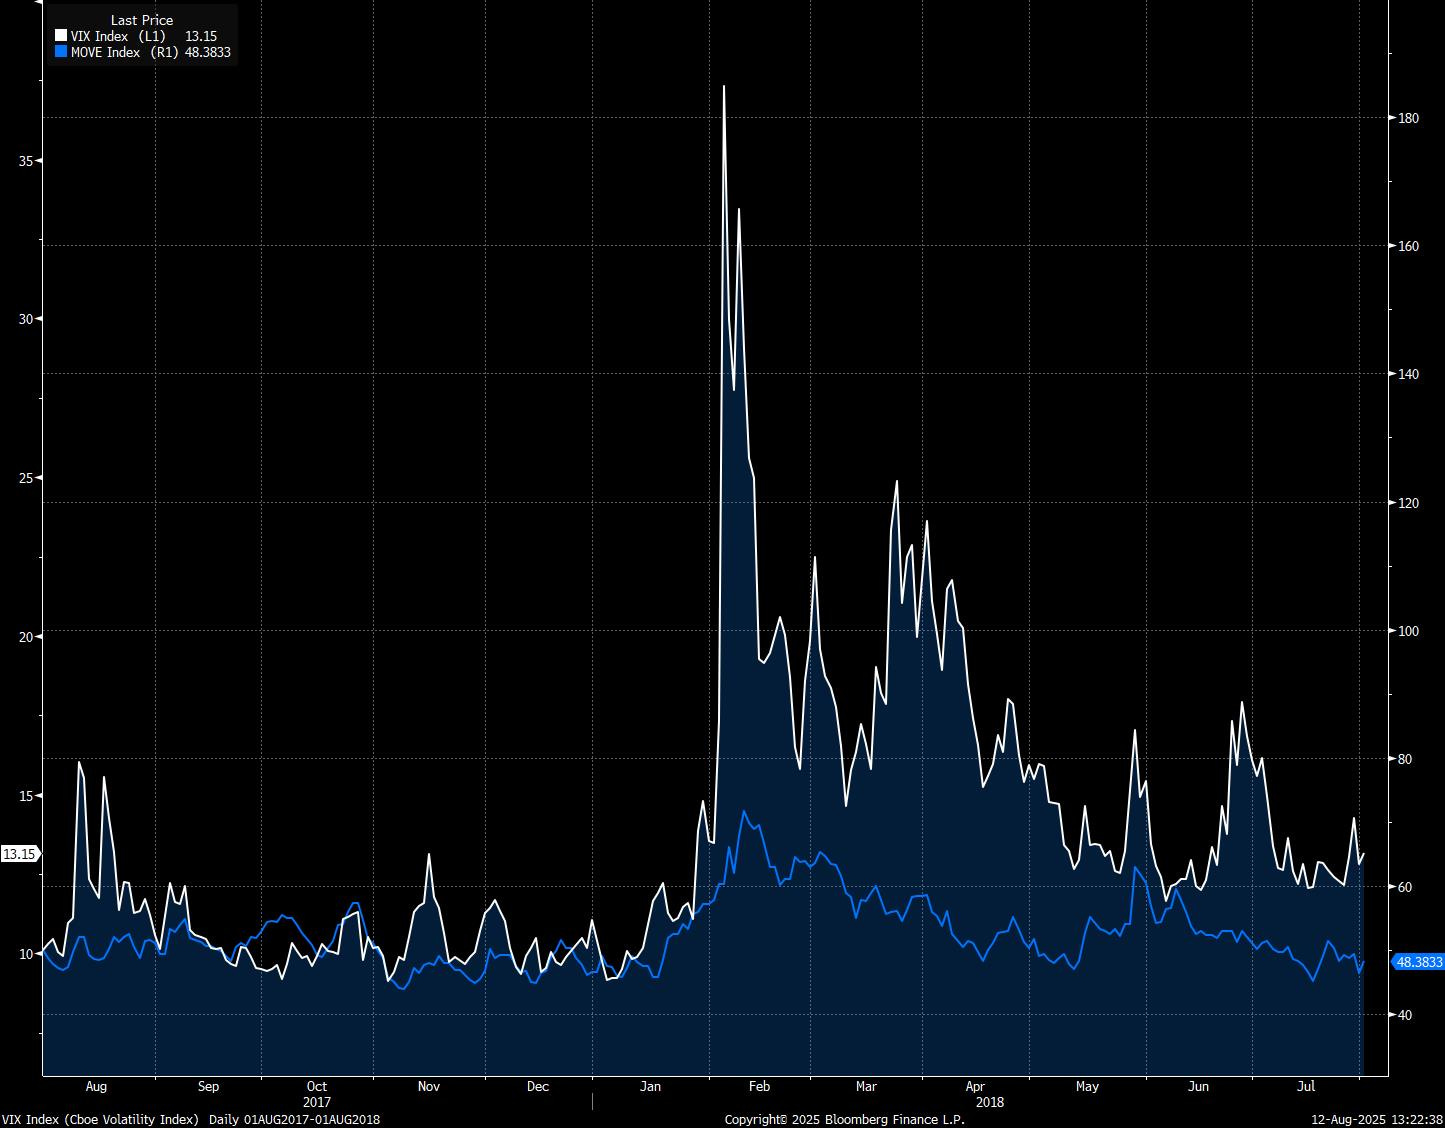
The result was a sudden, disorderly repricing in the volatility complex. XIV, one of the most popular inverse-VIX products, lost over 90% of its value in a day and was subsequently liquidated. The episode revealed just how fragile the ecosystem of short-vol strategies had become, and how quickly structural positioning can turn a garden-variety equity pullback into a self-reinforcing volatility explosion.
2020, COVID Crash
What made the COVID volatility episode unique was its breadth and simultaneity: equities, bonds, and currencies all experienced extreme implied and realised volatility at the same time, breaking the usual negative correlations that underpin multi-asset hedging strategies.
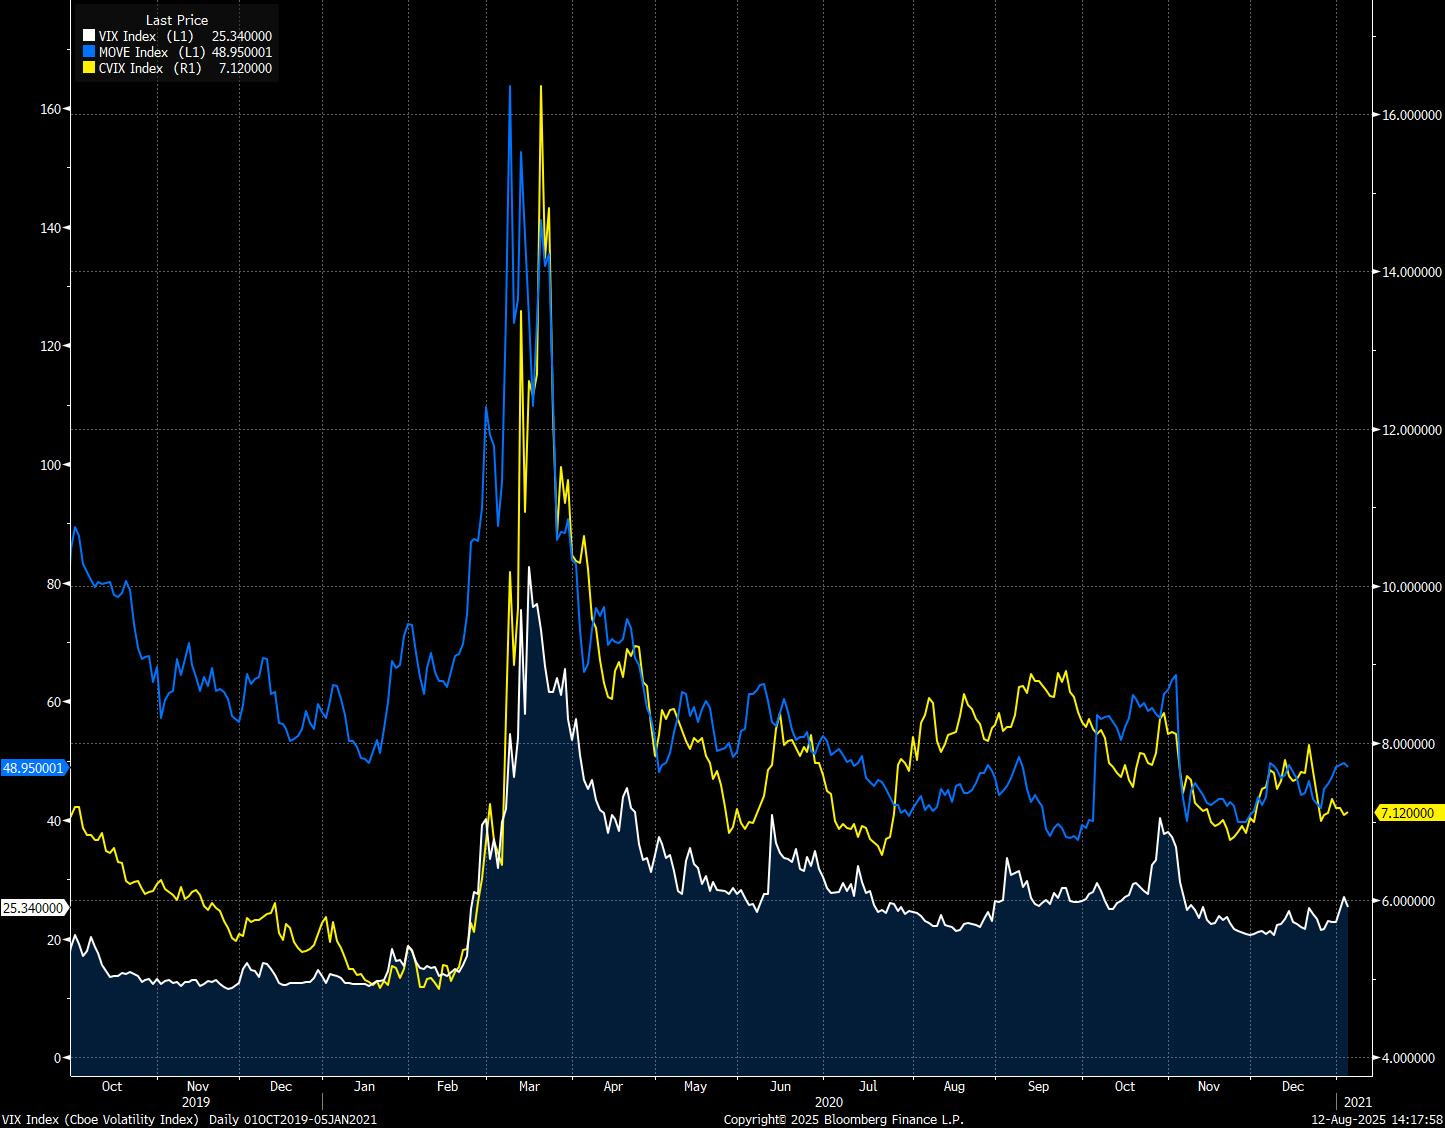
In equities, the VIX surged from a calm pre-pandemic level in the low teens in February 2020 to an intraday peak of 85.47 on March 18, 2020, just shy of its all-time GFC highs. The move was not just about the magnitude—it was the speed. Within a matter of weeks, equity implied volatility went from pricing orderly markets to reflecting full-blown systemic stress.
In fixed income, the MOVE index also spiked to extremes, breaching 160 in mid-March 2020. That jump was fueled by extraordinary swings in U.S. Treasury yields, driven by a scramble for cash, dysfunction in Treasury market liquidity, and aggressive repricing of Fed policy expectations as the central bank delivered emergency rate cuts to zero. MOVE’s surge was notable because Treasuries usually act as the calm, stabilising leg of a portfolio—yet in March 2020, they became a source of volatility themselves.
The CVIX spiked sharply as well, reflecting turbulence in currency markets as investors unwound carry trades, sought USD liquidity, and navigated unprecedented central bank and fiscal interventions. Dollar funding stress, revealed through widening cross-currency basis swaps, compounded the volatility in FX.
How Traders Use Volatility Products
There are an almost limitless number of permutations as to how and why someone might want to trade using volatility as a direct or indirect proxy. Below are some of the main ones from our experience.
VIX Calls To Hedge
When volatility is underpriced relative to event risk, or simply to hedge an existing portfolio, buying VIX calls and long VIX futures can provide asymmetric protection against equity drawdowns.
Calls offer defined-risk convexity, with payoff profiles that expand rapidly during vol spikes, making them well-suited for tail hedging when gamma and vega sensitivity are desired.
Futures provide more linear exposure to expected VIX levels at expiry, useful for tactical positioning ahead of known catalysts. The trade-off is that futures carry roll costs in contango and can bleed during quiet periods, whereas calls suffer time decay but avoid roll yield.
Sizing should be calibrated to the portfolio’s equity beta and expected vol beta, with notional chosen to offset drawdowns over the time period in question. In practice, traders often stagger maturities to reduce event timing risk and blend outright long calls with spreads to manage premium outlay while maintaining protection.
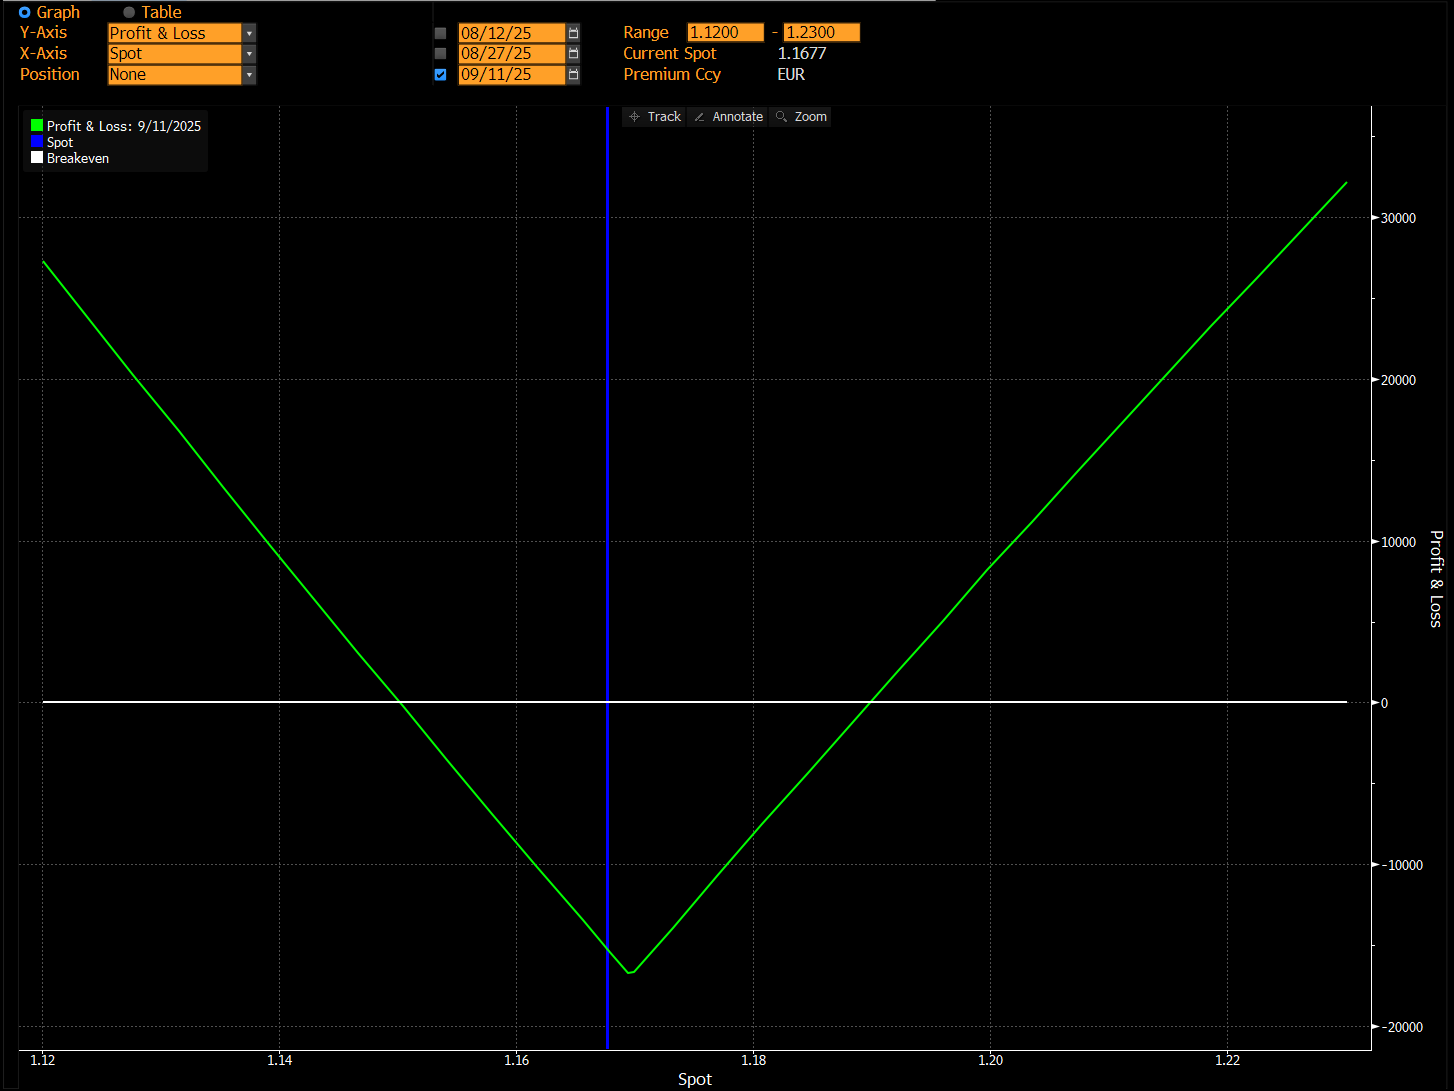
FX Options Structures
Traders don’t really use the CVIX as a way to exploit volatility movements. Rather, they use option structures on individual currency pairs that can benefit from a directional move in volatility.
For example, let’s say a trader takes a view that the implied volatility for the coming month on EUR/USD is too low. This could be due to events taking place during the next month, such as elections, central bank meetings or data prints.
They could buy a one-month ATM Straddle structure. This involves buying a 50 delta Call option and a 50 delta Put option, paying a combined upfront premium. This trade is direction agnostic. The trader doesn’t really care if the market moves higher or lower. But what he has isolated is the volatility element of the currency. He’s betting on a significant move (either way) and therefore a rise in realised volatility during the month.
Long Gamma Via Swaptions
Traders use long gamma positions via swaptions to protect against sharp, unexpected moves in interest rates—particularly when Federal Reserve policy uncertainty is high.
In practice, this means buying out-of-the-money payer and receiver swaptions on longer-dated swaps (often 5y–30y tenors) so that the position has high gamma exposure.
Gamma measures how quickly a position’s delta changes as rates move; being “long gamma” means the position gains sensitivity to the underlying rate in both directions as volatility increases.
When the Fed’s policy path is unclear—say, the market is debating whether the next move is a cut, a hold, or even a hike—long-end yields can react violently to incoming data or shifts in forward guidance. Long gamma positions thrive in such an environment because they benefit from large intraday or intraweek rate swings. For example, if you’re long a payer swaption on 10-year rates and yields suddenly spike on a hawkish Fed surprise, the option’s delta rapidly increases, and the mark-to-market gain from being long gamma can outweigh the premium cost. Conversely, if yields drop on a dovish pivot, a receiver swaption can capture the upside.
In many cases, traders mirror the earlier concept in FX structuring, namely buying straddles in long-end swaptions—owning both payer and receiver optionality—to create a direction-agnostic hedge that profits purely from realised volatility exceeding the implied levels at which the options were bought.
Equity Vol Dispersion Trades
An equity dispersion volatility trade is a relative-value position between index options and the single-stock options of its constituents, designed to isolate and trade correlation.
In the classic long-dispersion setup, the trader sells the index straddle or strangle and buys weighted straddles or strangles on the component stocks. This creates a position that is long single-name gamma and vega while short index gamma and vega, effectively betting that realised correlation will fall below the level implied in market pricing.
Because index volatility is a function of the average constituent vol and their pairwise correlations, a drop in correlation means individual stocks move more independently, causing single-stock options to outperform the index options on a hedged basis.
The P&L comes from this correlation differential as well as any relative mispricing in vol between the two legs, with traders often delta-hedging both sides to focus purely on the correlation exposure. Risks include sudden spikes in correlation—common during market stress—which can cause index vol to surge relative to single names, as well as the execution complexity and hedging costs of managing a large basket of single-stock options. In practice, many desks use a liquid subset of names to proxy the index and carefully size and hedge the trade to manage correlation shocks and vol term-structure mismatches.
Variance Swaps
A variance swap is an OTC product that gives you a pure, delta-neutral exposure to the realised variance (volatility squared) of an underlying over a set period.
At the start, both sides agree on a “variance strike,” which reflects the market’s current expectation for future volatility, squared. When the contract ends, the actual volatility that happened during the period is measured and squared to get the “realised variance.”
The difference between this realised variance and the strike determines who makes money: if actual variance is higher than expected, the trader who bought variance gets paid; if it’s lower, they pay the other side. Because variance is volatility squared, big market moves have an outsized effect on the payoff, which makes variance swaps very sensitive to sudden spikes in volatility. In short, it’s a pure way to trade the market’s choppiness, separate from any directional price bets.
Market Participants: Who’s In the Game?
Banks
Role: Primary market-makers in OTC volatility products (variance swaps, vol swaps, dispersion trades, exotics) and liquidity providers in listed volatility products (index and single-stock options, VIX derivatives).
Objectives:
- Facilitate client trades and earn bid–ask spreads.
- Warehouse volatility risk temporarily and hedge it through option markets or dispersion strategies.
- Run correlation books, volatility arbitrage books, and structured product hedges.
Typical Positions:
- Often short vol from selling to yield-hungry clients, hedged via option portfolios or other vol products.
- May be long vol opportunistically in stressed markets to offset structured product exposures.
- Pure vol trading jobs are rare these days, with most being incorporated into derivative structuring roles:
Hedge Funds / Volatility Arbitrage Funds
Role: Opportunistic traders in volatility mispricings, correlation trades, and tail hedges.
Strategies:
- All of the above trading strategies we ran through apply, ranging from dispersion ideas to hedging existing positions.
Profile:
- Often more nimble than dealers; will actively take the other side of structured product flows.
- Use vol as a tactical overlay—buying gamma around events, expressing convexity views.
Asset Managers / Pension Funds
Role: Large end-users of equity and index options, often as overlays on long equity portfolios.
Objectives:
- Hedging: Use long vol positions (protective puts, collars, VIX calls) to insure against drawdowns.
- Yield enhancement: Selling covered calls or put spreads to generate income, taking on short vol risk.
Impact:
- Their systematic overwriting programs create a steady supply of short-dated index vol.
- Demand for hedges can spike during uncertainty, pushing up index skew.
Retail / Structured Product Buyers
Role: End clients around the globe, particularly HNW individuals, frequently buy structured notes linked to equity indices with yield-enhancing features.
Mechanics:
- These products are created by selling options (short vol) to the client, with the dealer taking the other side.
- Dealers then hedge, often by selling vol in the listed market — adding to supply.
Risks:
- Selling structured products to retail can offer headaches when they go wrong, with accusations of misselling or the complexity of products being beyond what should be sold…
Volatility as a Cross-Asset Compass
Volatility products are more than fear gauges—they’re structured, tradable expressions of market uncertainty. Whether it’s VIX for equities, MOVE for rates, or CVIX for currencies, each tells a different story. Together, they offer a powerful cross-check on market complacency, dislocation, and where the next storm may be brewing.
Trading volatility products isn’t for the faint of heart. The complexity of using them in real life can be problematic unless you fully understand how to price them and risk-manage around them.
Yet ultimately, global markets are becoming increasingly choppy. So for cross-asset traders, understanding volatility signals—and how they interact—isn’t optional. It’s alpha.
AP
Disclaimer: This material is provided for educational and informational purposes only. It does not constitute investment advice, a recommendation, or a solicitation to buy or sell any security, derivative, or other financial instrument. Trading in volatility products—including, but not limited to, listed and OTC options, variance swaps, volatility swaps, VIX derivatives, and structured volatility strategies—involves substantial risk of loss and is not suitable for all investors. These instruments can be complex, highly leveraged, and sensitive to factors such as implied volatility, realised volatility, correlation, interest rates, and market liquidity.
Past performance is not indicative of future results. Market conditions can change rapidly, and strategies that appear effective under certain circumstances may result in significant losses under others. The examples and trading approaches described herein are illustrative only and may not account for transaction costs, bid–ask spreads, margin requirements, tax considerations, or operational risks.
You should carefully assess your financial situation, risk tolerance, and investment objectives, and seek advice from a qualified financial professional before engaging in any trading involving volatility products. The author(s) and publisher make no warranties, express or implied, regarding the accuracy, completeness, or reliability of the information provided, and accept no liability for any loss or damage arising from reliance on this material.
Another banger