

Hot Inflation Froze the Fed
What next for the battle on inflation?

We closed out 2024 with a December inflation reading on the cooler side. Headline was in line with expectations of 0.4%, and core figures came in below the 0.3% estimates at 0.2% MoM. The first reading of 2025, however, is a different story.
A headline reading of 0.5% MoM and a core reading of 0.4% were above consensus. The gain pushed 12-month inflation to 3% in January, marking a pickup from December, when prices rose 2.9%.
For those who get bored by the numbers and want us to reach the point, Wednesday’s report indicates that inflation progress is in danger of reversing. This, combined with a solid labor market, puts the Fed’s path and concerns about the battle at hand into question.
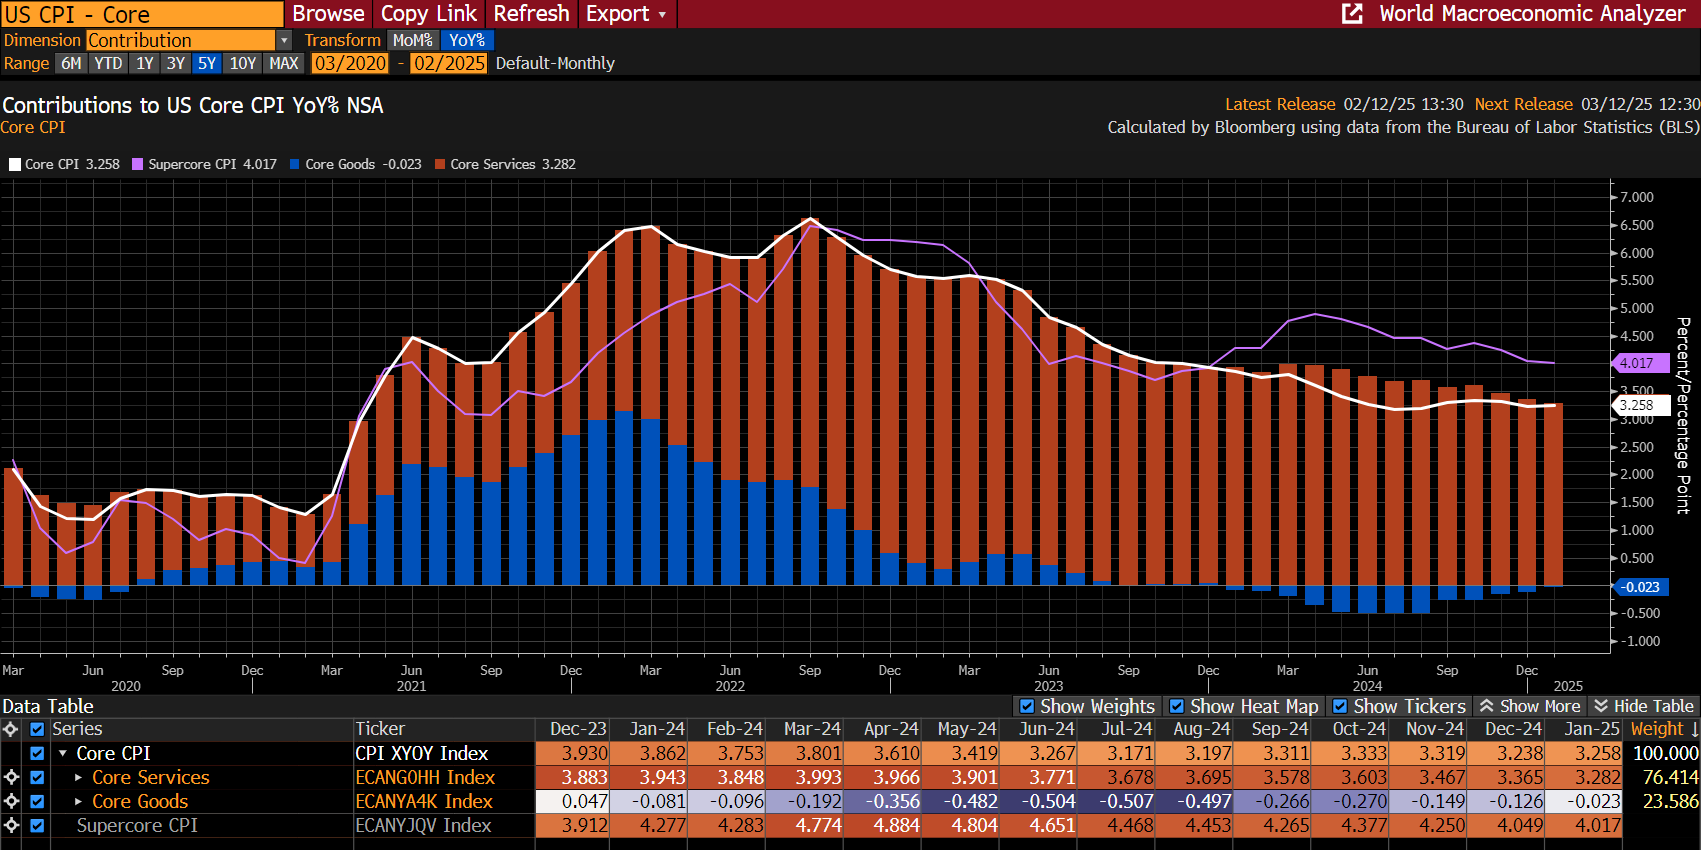
Core goods are no longer offering a deflationary offset to the overall core print. While heavy weighting in the services category such as shelter costs are not as high, other elements have firmed, meaning that the overall core figure isn’t falling.
Let’s Talk Powell
Federal Reserve Chair Jerome Powell said the latest consumer price data indicates the central bank has made significant strides in curbing inflation, but there is still more work ahead.
“I would say we’re close, but not there on inflation,” Powell told the House Financial Services Committee during the second day of his semi-annual testimony to Congress. “Last year, inflation was 2.6%—so great progress—but we’re not quite there yet,” The 2.6% figure referenced is the core PCE data, which the Fed hold as their preferred measure.
What was interesting was the size of the move. To dig into the finer details, the core reading was 0.446%. Taking a broader look back, that figure comes in higher than any pre-pandemic reading since 1992. Perhaps it’s the recent fluctuations in this round of inflation that have made us somewhat blunted toward that kind of change.

The data came in above all forecasts. The beginning of the year is the most logical time for businesses to push through price increases, especially when the economy is strong. There are also tariff concerns, which may have increased front-loaded purchasing. These two factors created a higher chance of an upside surprise going into the data print.
Following the new data, interest-rate swaps showed traders expected just one quarter-point rate cut this year.
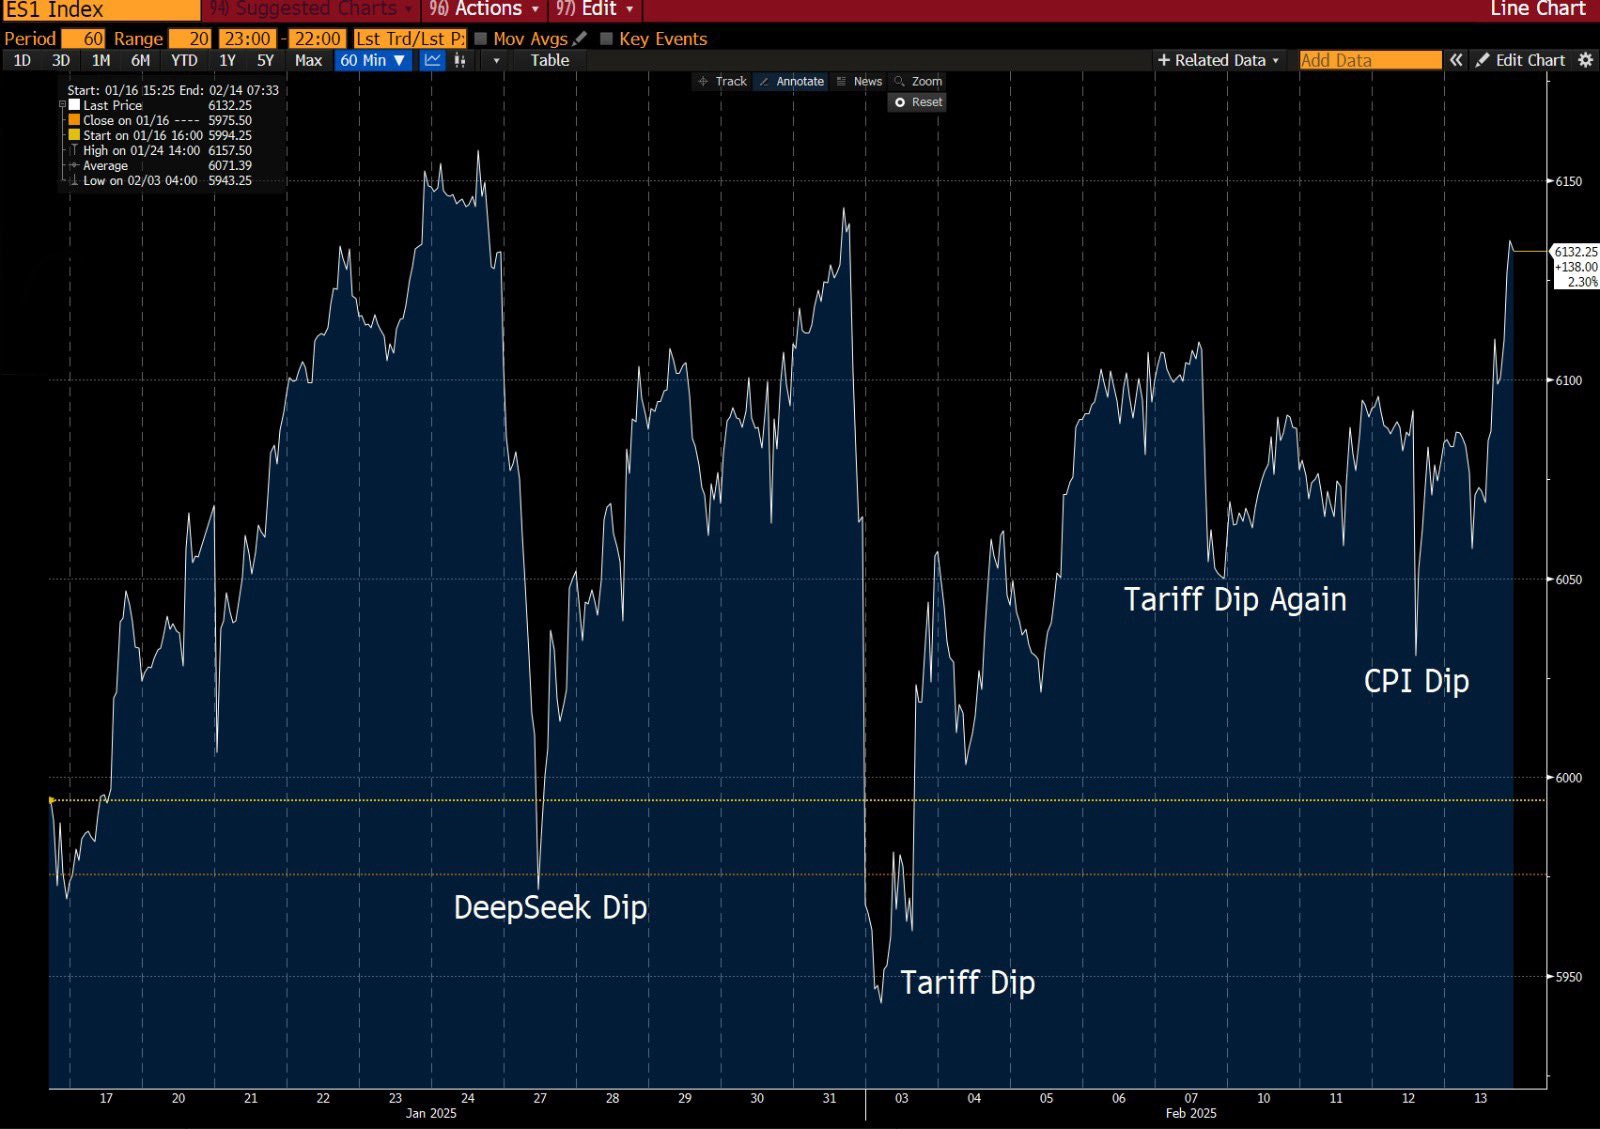
In other assets, the dip was mainly bought, which seems to be the 2025 mantra. Take a look at equities. The bigger the dip, the bigger the opportunity, it seems.
What About Stagflation?
To add a twist to the week, Friday’s retail sales report was a bit of a shocker in that all variants of the report showed a month-on-month decline. The Treasury rally on the news suggests the market has rallied not just on the anticipation of rate cuts but on fears of economic weakness. That underscores the fragility of stocks, particularly tech megacaps.
You can see the slowdown fears in interest-rate swaps where the first fully-priced Fed rate cut has now moved forward to September. To wit, also look at comments by President Trump just ahead of the consumer price index release on Wednesday:

The layers of intellectual confusion here are hard to parse. The inference is that tariffs—which economists assume increase US consumer prices—require a rate cut to offset the policy. Given the higher prices would reinforce higher-for-longer policy, the President’s post can only mean the Fed will have to lower rates to offset the negative economic impact.
The totality of all Trump policies is leading to this stagflationary combination of price pressure increases and weaker growth. It’s clear that the trend of inflation isn’t down, and 1y inflation swaps are now at 2.95.

Bond investors are in a tough place because the risks on the Fed’s dual mandate are going in opposite directions. The upside surprises on economic data and inflation are less likely to drive long-dated bond yields to 5% but inflation and expectations of more price pressures are so high, it kind of limits rate cuts here. How much lower can yields go, barring a deep fall in growth?
Overall, it’s possibly megacap fragility that is the big takeaway here, despite the arguments that the Magnificent Seven are places to hide in a slowing growth environment. Stagflation is not good for asset prices, especially long-duration ones like tech stocks. The last time we saw anything like this materialise, it was late 1976. By March 1978, the value of equities had dropped by more than a quarter in real terms.
Talking of the 70s…
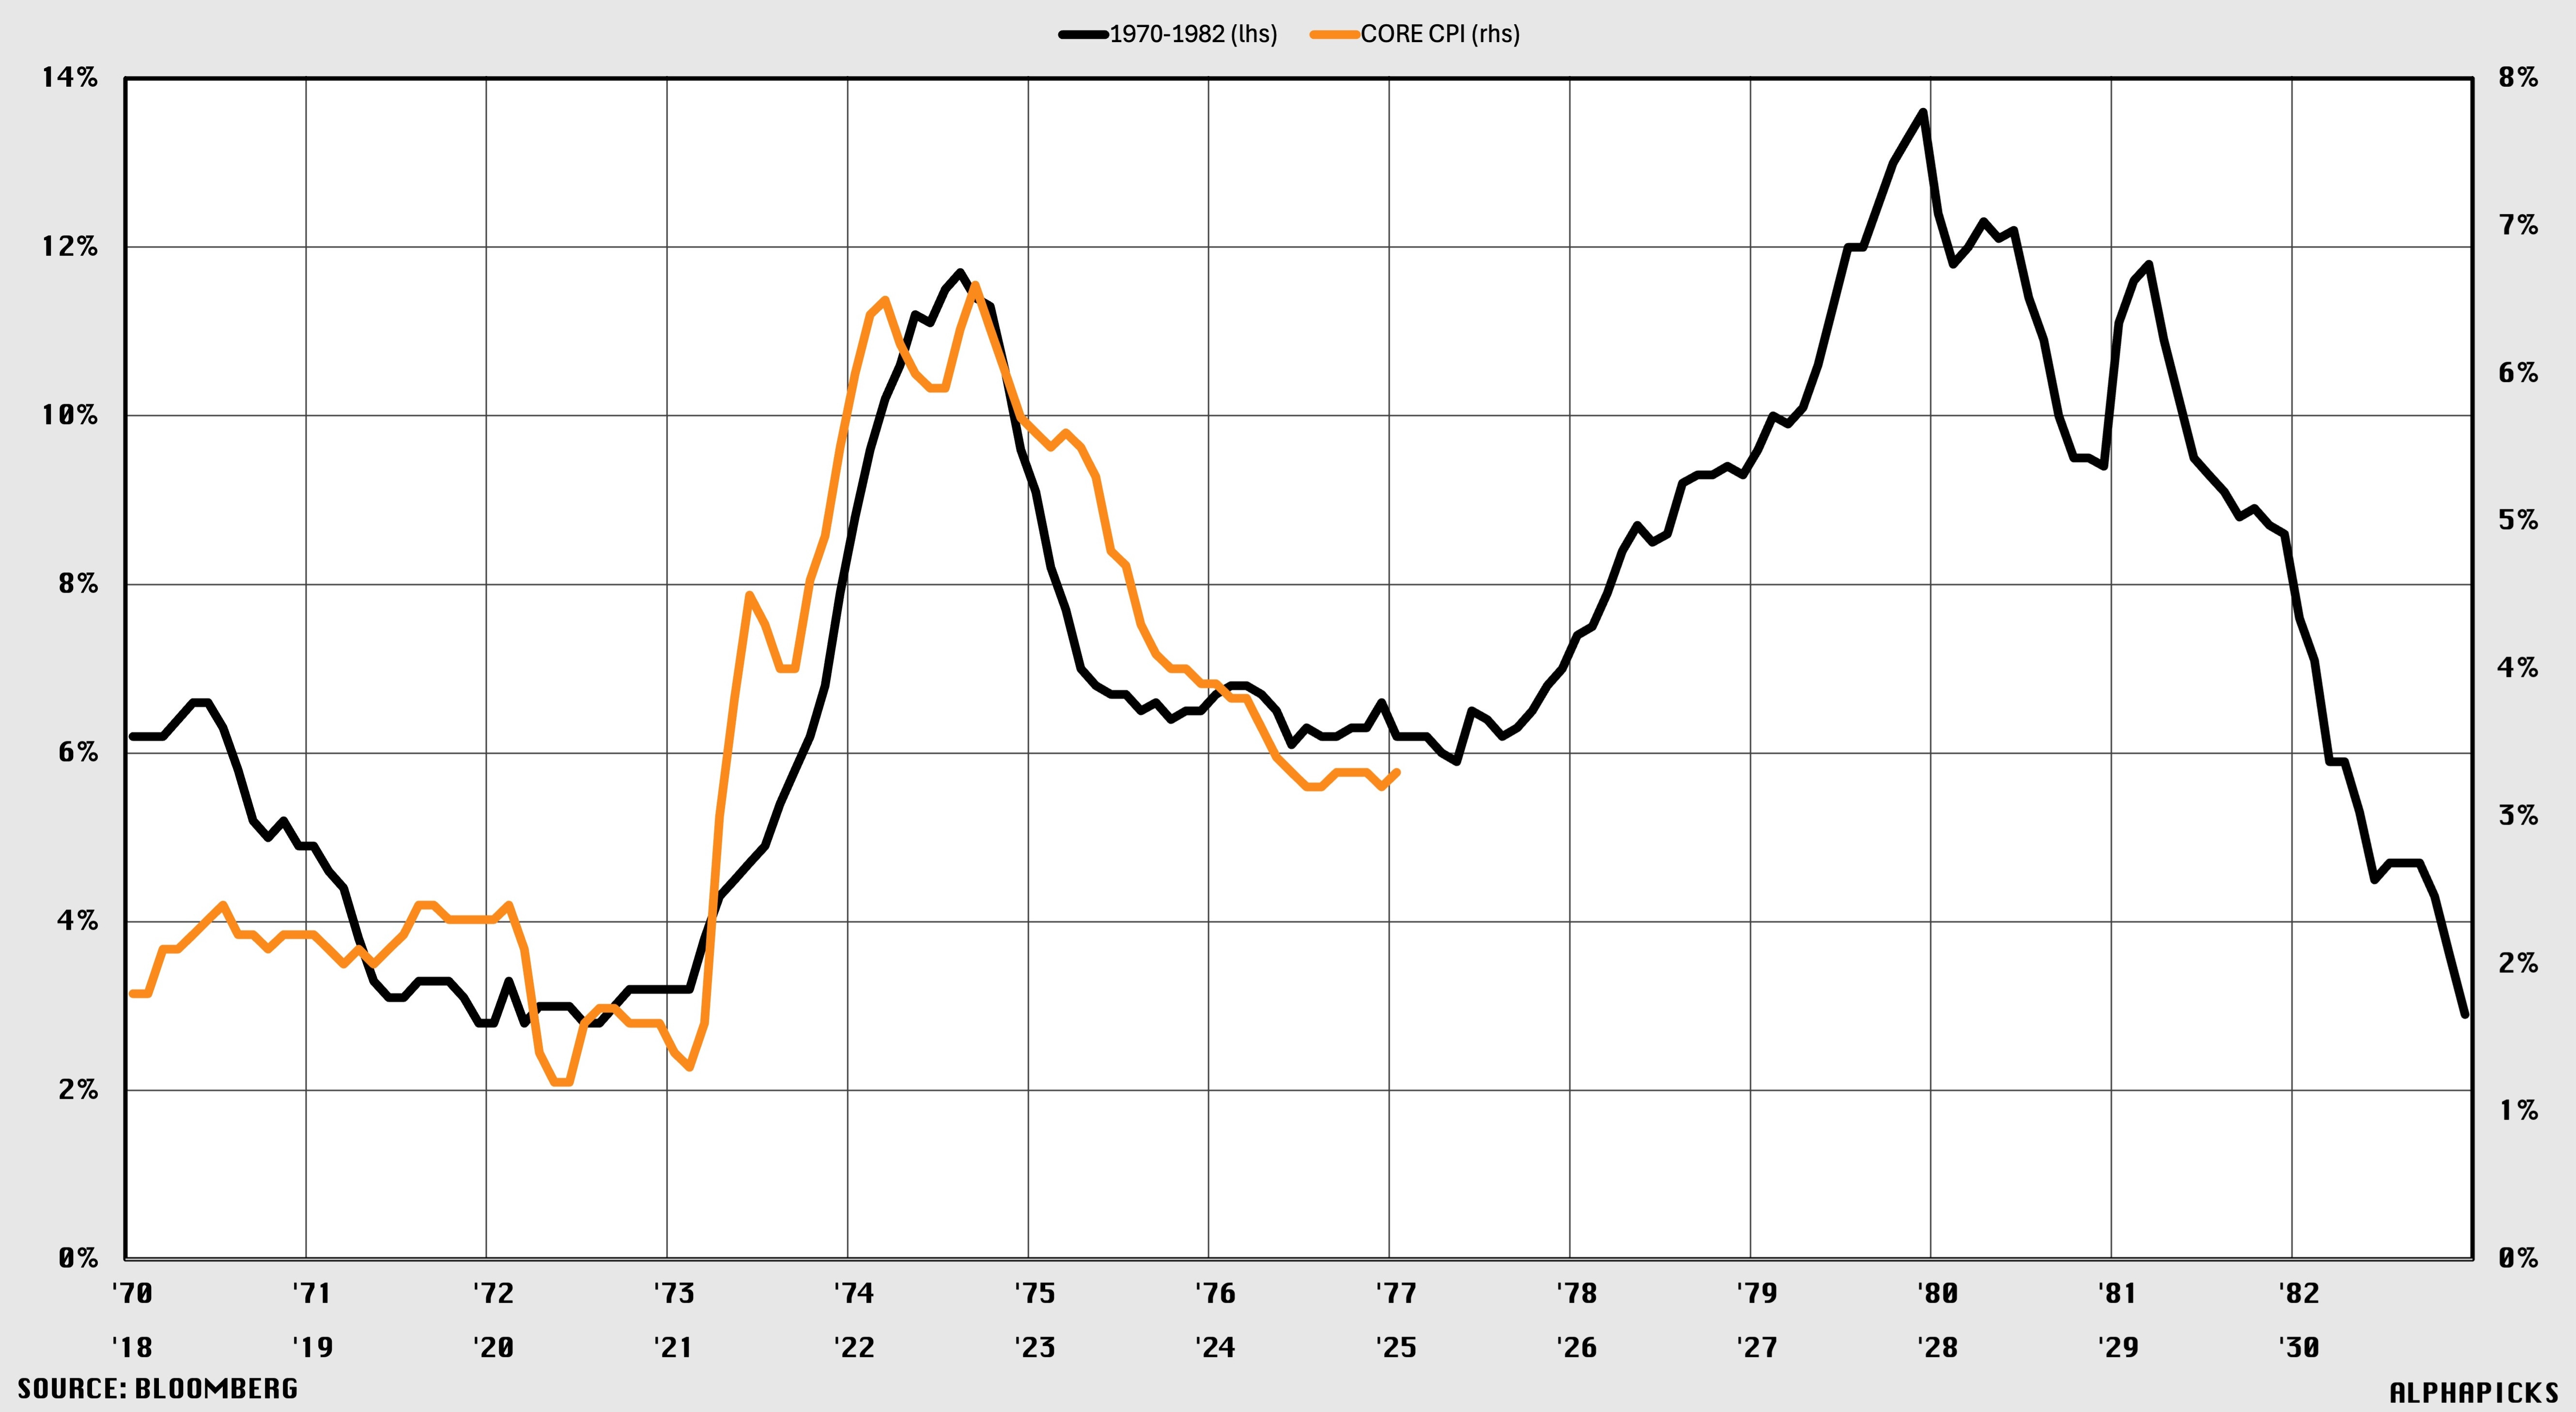
People like to throw this one around as a basis for believing that inflation will pick up. While it is an interesting comparison, there are different driving dynamics, which come as the usual disclaimer when looking for any correlation/causation charting with the past.
PCE
To add a ‘Word on the Street’ style to the end of this, GS had this to say regarding PCE:
“Based on details in the CPI report, we estimate that the core PCE price index rose 0.35% in January (vs. our expectation of 0.32% prior to today’s CPI report), corresponding to a year-over-year rate of +2.64%. Additionally, we expect that the headline PCE price index increased 0.38% in January, or increased 2.51% from a year earlier. We estimate that the core PCE categories that we identified as exhibiting residual seasonality will turn from a 5bp drag in December to a 4bp boost in January. We estimate that market-based core PCE rose 0.26% in January.”
PCE data for January releases on Feb. 28th. The last three months have stayed steady with core at 2.8%. If figures came in line with GS estimates, say 2.6-2.7%, that should ease some concern from the Fed and markets about the upside risk.
Below shows a more granular breakdown:

That wraps things up for today. If you’re not yet a premium subscriber, you can check out prices and what we offer here. We’re a reader-supported publication, and have appreciated the support of our core readers so far. Lots more to come.
See you tomorrow,
AP