JP Morgan Has A New AI Trading Model...And It's Good
We looked at the new 'Hawk-Dove Score' from the investment bank and if retail traders can benefit.
The Hawk-Dove Score analyses language from Fed officials and rates it as hawkish or dovish.
It then can provide a trading signal in the lead up to the next Fed meeting, if there’s a mismatch in language versus expectations.
Although unlikely to be made available to the public, we flag up other trading models that do work.
So far this year, artificial intelligence has returned as a very hot topic. OpenAI has led the way, with ChatGPT being the source of wonder, bewilderment and sometimes anger from users.
Yet, if we know one thing about any form of technology, financial professionals always want a piece of the action. The primary question is always, ‘How can we use this tool to create trading signals or provide us with more of an edge?’
Well, we have a sign of what this could look like, with JP Morgan unveiling this week what it calls the Hawk-Dove Score (HDS) to provide signals relating to the US Fed central bank statements and speeches.
What exactly does it do?
The model runs a ChatGPT language screener and puts through it all the Fed member speeches in between the usual monthly Fed policy meetings. The AI detects whether the words and phrases being used are hawkish or dovish.
Based on this, it gives off a signal as to whether the next policy meeting will be more hawkish or dovish than the market is currently expecting. Depending on the numerical figure that gets spit out, it could flag enough of a discrepancy to place a trade.
For example, let’s say the AI flags up various hawkish member speeches going into a meeting that many feel will be a non-event. The trading signal would be given, and JP Morgan traders could decide to short stocks or go long the US Dollar. If the model is correct, the traders would profit from their positions.
Back-testing the model
Naturally, you’d expect the wizz-kids in the AI world, combined with the bank economists, to back-test this tool before putting it out there.
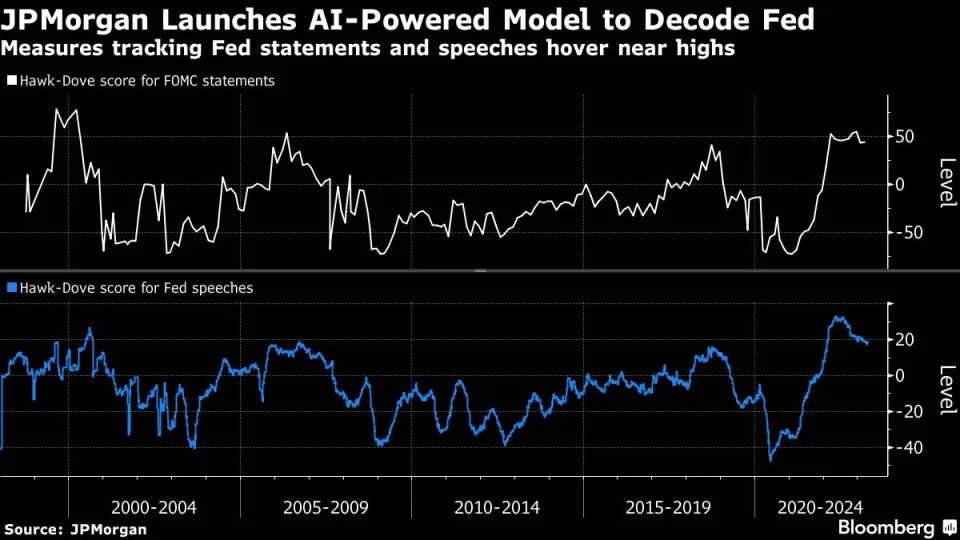
They have, based on 25 years worth of previous meetings and speeches. As can be seen from the below graphic, the tracking does have a strong correlation. The blue line is the Fed speeches, which would be the indicator used to flag up a potential trade for the following Fed statement (the white line).
For those wanting to get technical, a 10-point increase in the HDS equates to a 10% probability increase of a 0.25% hike at the next Fed policy meeting.
Same-same but different
We’re not claiming that using AI for trading is a new concept. In fact, a report back in 2018 on hedge funds showed that over 50% were already using it:
What is perhaps even more surprising (remember this was back in 2018) was how long some funds had already been making use of this tech:
However, we feel the ChatGPT model is such a leap forward in progress in this space that the competency and consistency with which it can assist a trading user makes it different to past user cases.
Further, the adoption of it by a major bank signifies another step forward in a way that previously wouldn’t have been pushed as heavily.
How can retail traders benefit?
There’s currently no mention of whether this will be a paid for tool for JP Morgan clients exclusively or if it’ll be made available to the public.
Given the lengthy regulations and restrictions around solicitation, particularly in trading, we feel this won’t be something given out for free to everyone.
To a certain extent, we don’t see this as a massive problem. Retail traders can make use of ChatGPT easily themselves, with our team having seen multiple examples of it being used for stock analysis and even earnings dissection.
When it comes down to trading signals, we also note that most retail traders have their own preferred method. This can be signals based on volume, technical levels or other indicators.
There are a few examples we like of algorithmic systems created by traders. Here are two of them, both available on TradingView.
Ripster
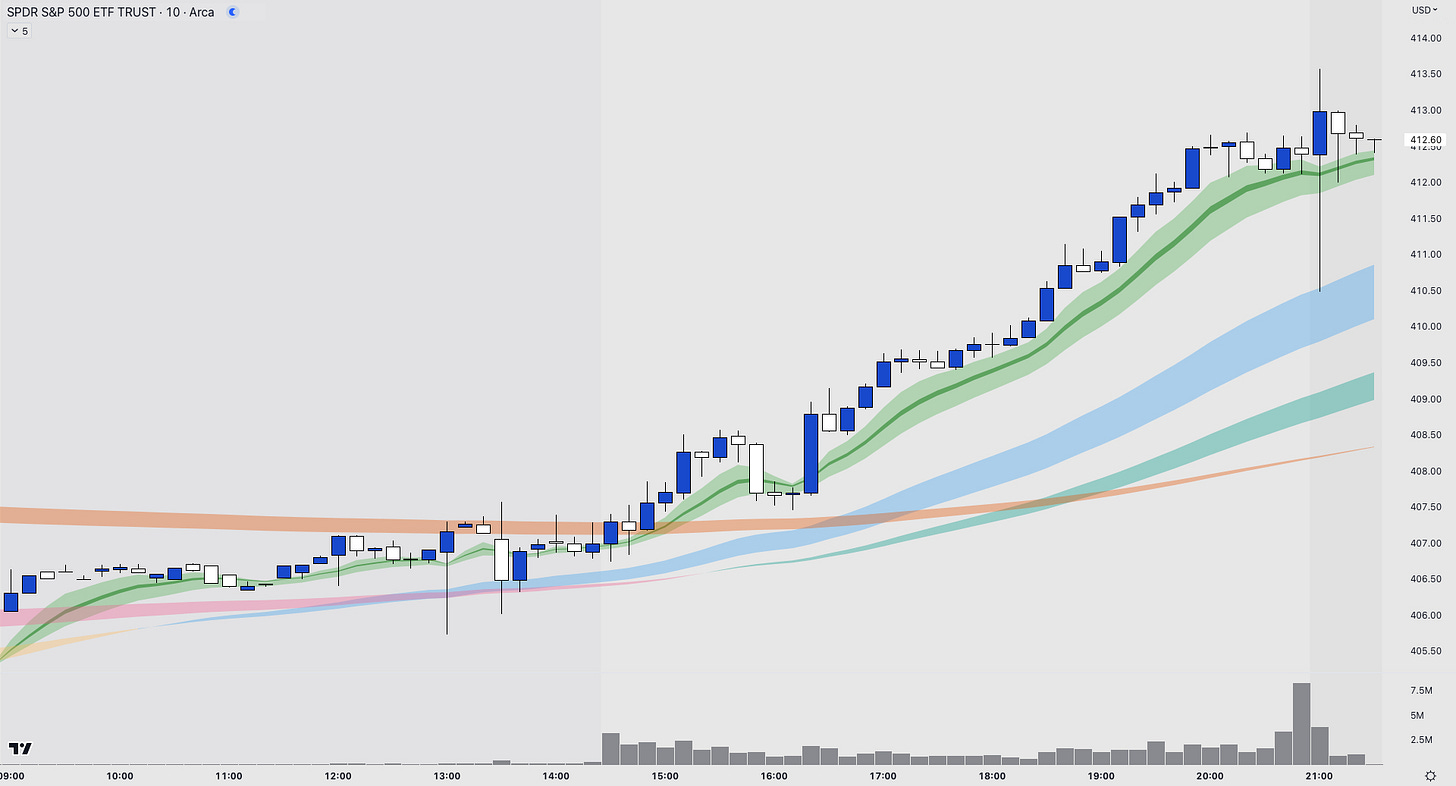
Ripster’s cloud EMAs are a great illustration of an indicator used to follow momentum.
His own trading system has been built on trading the 10min chart against these clouds, comprised of a 5-12 EMA, an 8-9 EMA and a 34-50 EMA.
A full rundown of this strategy can be found here.
As we can see for Thursday’s price action, the 10min 8-9 EMA held all day as SPY trended upwards.
SMT Indicator
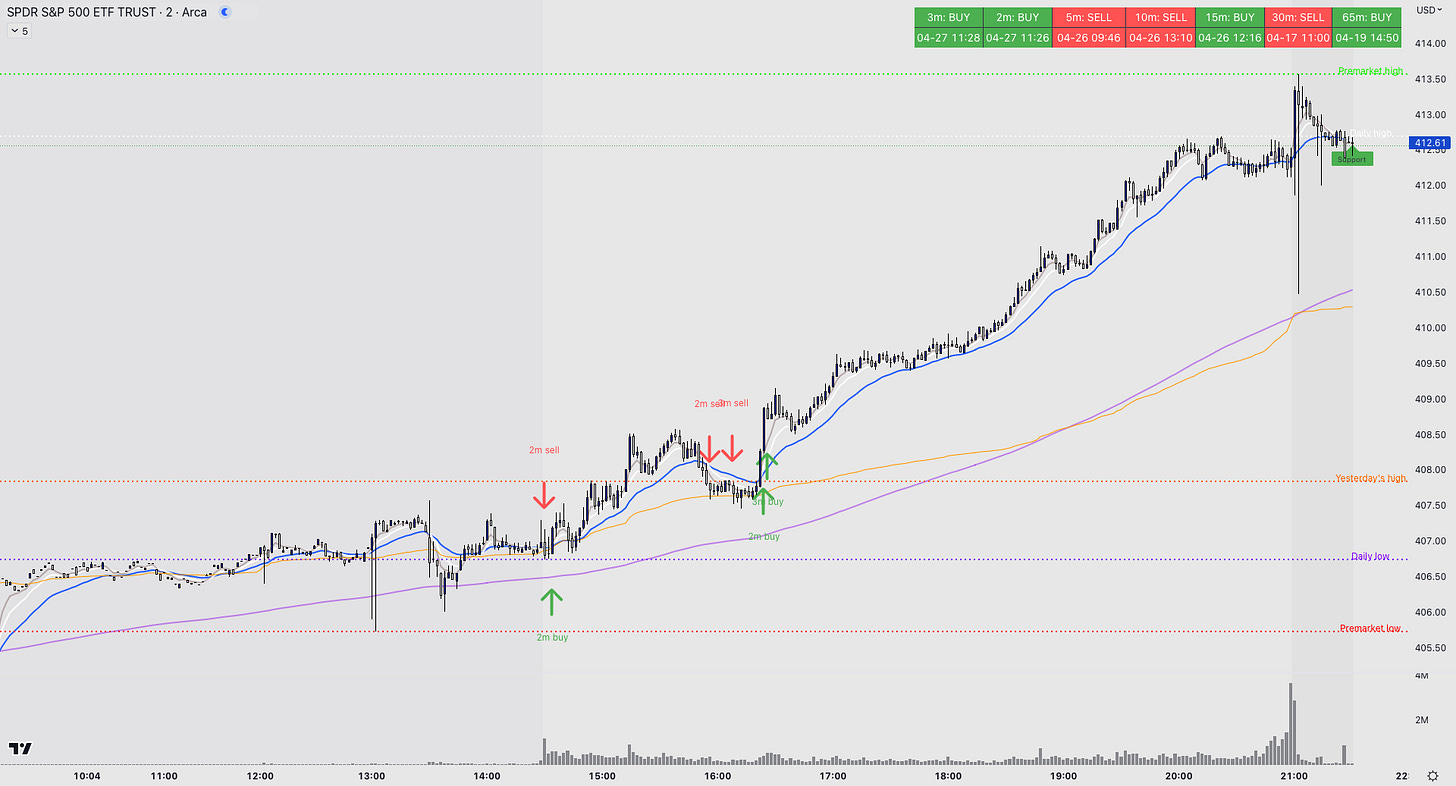
The SMT indicator is also a momentum led indicator. Focusing in on EMAs to follow trend, but including key levels for trading, such as previous day highs, lows, opening and closing prices.
The indicator has the ability to display multiple time frame signals on current time frame, adding more confluence to signals.
A full rundown can be found here.
Again, looking into Thursday’s price action, we see that this algo went long when SPY had some increasing volume and started its trend for the day, leading to a $4+ move.
Although these indicators are not AI led, they are great examples of the technology available for traders to develop their own systems for technical analysis, something that traders of 20 years ago did not have.


