July Usually Brings The Sun
It's a good month for stocks and gold... and a bad one for the dollar.
As the year's first half ends, it’s fair to say that most of the popular predictions didn’t play out. No US recession came, inflation is cooling as the Fed look to (likely) pause rate hikes later this year, and US stocks are flying.
It was expected to see a new low on the S&P 500 sometime this year, but with prices now 27.5% higher than the October low, it would take a big downturn to see that happen. The Nasdaq Composite powered ahead 31.7% for its biggest first-half increase in four decades.
What could be in store over the next month?
Looking at the seasonality chart, July is often one of the best-performing months. 75% of the last 20 years saw July close higher, with an average return of 2.3%.
However, there are some factors this month to consider. We have had a pretty resilient market in the first half of this year, but one big question still needs to be answered: What does the economy look like in the back half of the year?
What’s to come?
Several indicators show growing optimism about equities. Positive sentiment in the American Association of Individual Investors survey has exceeded its historical average for four straight weeks, while positioning measures tracked by banks have shown investors recently increasing their exposure to stocks.
The Cboe Volatility Index (VIX), which measures investor demand for protection against stock swings, recently hit its lowest level since early 2020.
At the same time, July brings its share of potentially market-moving events. First up is this Friday’s U.S. employment report will give investors a snapshot of how the economy is faring after 500 basis points of rate hikes from the Fed since last year, the most aggressive tightening in decades.
Signs of continued solid job growth could reinforce a view that has helped boost markets this year: that the U.S. economy can avoid a severe recession despite the Fed’s tightening.
Omar Aguilar, chief executive officer and chief investment officer of Schwab Asset Management, said, “The labour market is probably going to end up proving to be the big catalyst for what may happen market-wise and also monetary policy-wise.”
Second-quarter corporate results will kick off the following week. S&P 500 companies are expected to post an overall drop in earnings of 5.7% from the year-earlier period.
S&P 500 forecasts
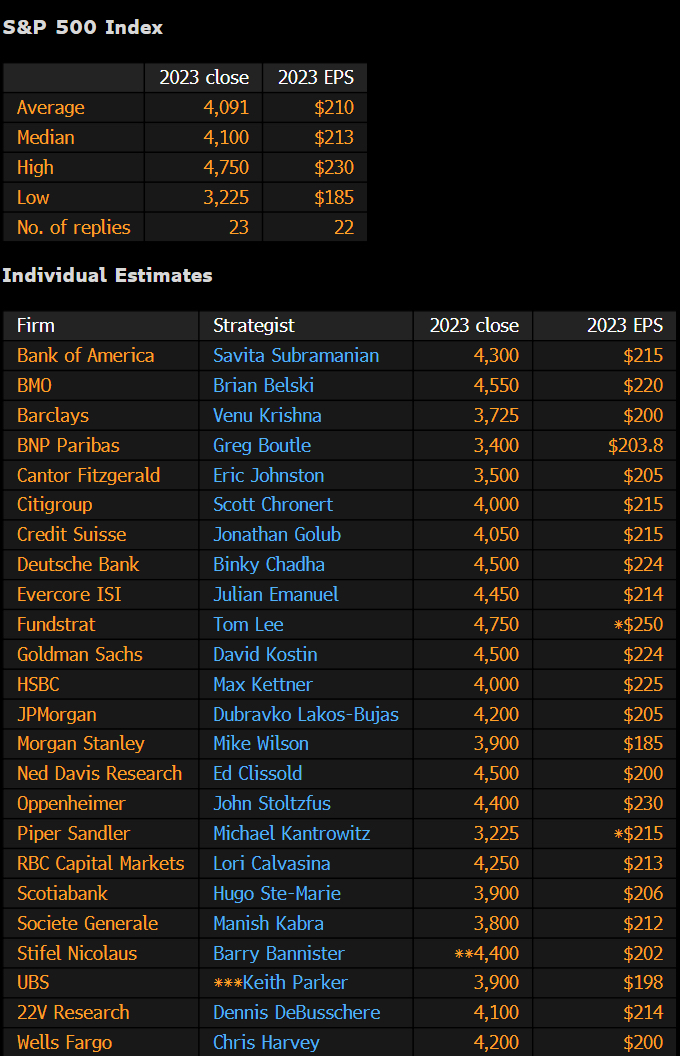
A recent survey among top analysts saw the average estimate for the S&P 500's 2023 closing price at 4,091. The median result was 4,100, with 4,750 coming in as the high and 3,225 as the low.
Average EPS estimates came in at $210.
What about other securities?
As the chart below illustrates, FX seasonality often shows USD weakness. Two notable pairings are EUR/USD and USD/CAD.
EUR/USD has the highest performance during this month, with an average return in the last five years of 1.21%. The Canadian dollar also has had relative strength, as the average performance of USD/CAD was a 0.91% decline.
The frequent dollar weakness is partly what contributes towards a strong equity month. In basic terms, as the dollar weakens, you need more dollars to buy shares, so prices rise. There are many other factors that contribute, but this correlation is more commonly seen between gold and the dollar.
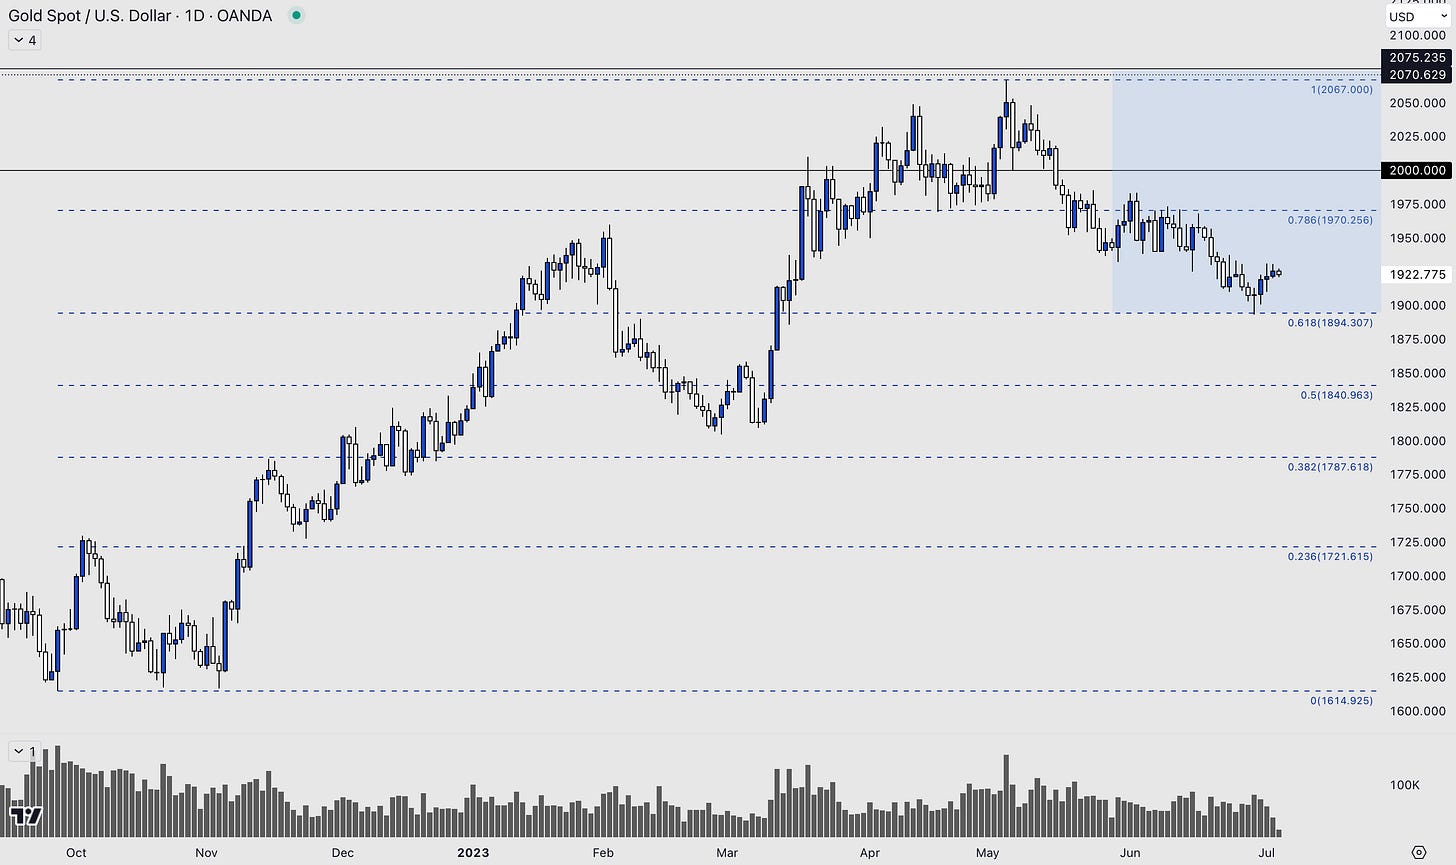
The five-year average performance for gold is 2.74%. We have had a view for several months that gold would be rangebound, failing to break and hold above $2,000.
Below is our unchanged chart from that post two months ago. Price has bounced off the 0.618 Fibonacci retracement, and if we consider the seasonality of gold, we could be seeing a push above $1,970 this month.


