

Meet A New Trading Strategy: Implied vs Realised Vol
We present the case on how retail traders could take advantage of the booming options space.

Ever since the pandemic, there has been a marked rise in options trading activity. This has actually been driven primarily by retail investors, thanks to commissions being cut and the ease of access from retail platforms.
Naturally, the initial phase of education is simply from buying a Put or a Call with a short-dated expiry. This has since developed, with speculation on zero days to expiry (0DTE) options blowing up, along with more sophisticated strategies taking off.

Of course, there’s a big jump (which is unlikely to ever happen) to more complex options. For example, will retail platforms ever offer knock-out’s, knock-in’s, accumulators, TARF’s to a wider audience? There exist so many complications to opening up new products in the derivatives space.
With this being the case, the big push that we’ve noted over the course of 2023 has been getting to grips with volatility. Implied volatility (IV) is an element that can be backed-out of an options price at any point of time.
Retail platforms have added IV so that it’s visible to traders, alongside the price of the option.
If a trader thinks that the implied volatility is too high or too low, they can buy vanilla Puts or Calls in a way to not punt on the direction of an asset, but rather on the change in volatility.
We take this a step further with our below options trading idea, that compares the implied volatility for the next 30 days versus the previous realised volatility from the past 30 days.
As well as breaking down the idea, we also run through stocks that look ripe to be taken advantage of using this strategy, as well as talking through how it can be implemented using most retail platforms.
Before we get into it, please note that option buying and selling should only be done by experienced investors who are aware of the risks around using derivatives. The information we provide is for educational use only.
The concept
Let’s say that a stock has realised volatility of 70 over the past month, but implied volatility of 35 for the next month.
This essentially tells a trader that the market expects the stock to be less volatile over the next month than in the previous month.
This might be for a valid reason. For example, last month the firm might have announced quarterly earnings. Or it could have been relating to a merger or acquisition media attention. These are factors that would have justified higher volatility in the share price.
Yet what if none of these factors were relevant for the particular stock? What if vol of 70 is normal, and the implied vol for the next month is simply too low? Situations in the market do exist where mispricing can happen.
Of course, if realised vol was 70 and implied vol is 68, the difference is so small that it doesn’t make sense to arbitrage it. But in our example, the difference is 50%.
In this case, a trader could decide that implied vol is too low and want to buy it. He could then buy a Call or a Put option, which would make him long volatility.
But what if he just wants to isolate volatility, and not be exposed to the stock rising or falling? He could buy a Put and a Call option, at the same strike and the same expiry (known as a Straddle). This would make him directionally agnostic.

If the stock moves up or down, it doesn’t matter. What matters is the size of the movements. If volatility picks up, the premiums of the options will rise, allowing the trader to profit.
If volatility does jump from 35 to closer to 70, a profit can be made. The risk is if the volatility falls from 35, in which case a loss would be booked.
In technical terms, we’re talking about buying an ATM Straddle for stocks with high negative vol spreads. But since we’re in the business of de-mystifying Wall Street jargon, the above explanation should be cleaner.
Which stocks make sense right now?
An idea in theory always sounds great, but what about putting it into practice right now.
Below we looked at the NASDAQ index and pulled the top 10 stocks with the largest negative or positive spreads on implied vs realised vol.
Take a look at the highest negative spreads:

The list is just the start though, as more homework is required. As a case, ON Semiconductor has one month implied volatility of 34, but realised volatility of 101. This high realised volatility was in part due to the disappointing earnings that were put out at the end of October.
So an investor would need to factor this in when thinking about if implied volatility is still too low.
The other angle is to look at stocks that have very high implied volatility for the coming month. In this case, selling a Straddle would be a way to short volatility. This would be if the trader expected the volatility to fall back to the realised volatility from the previous month.
Here are the top 10 largest positive spread NASDAQ stocks right now:
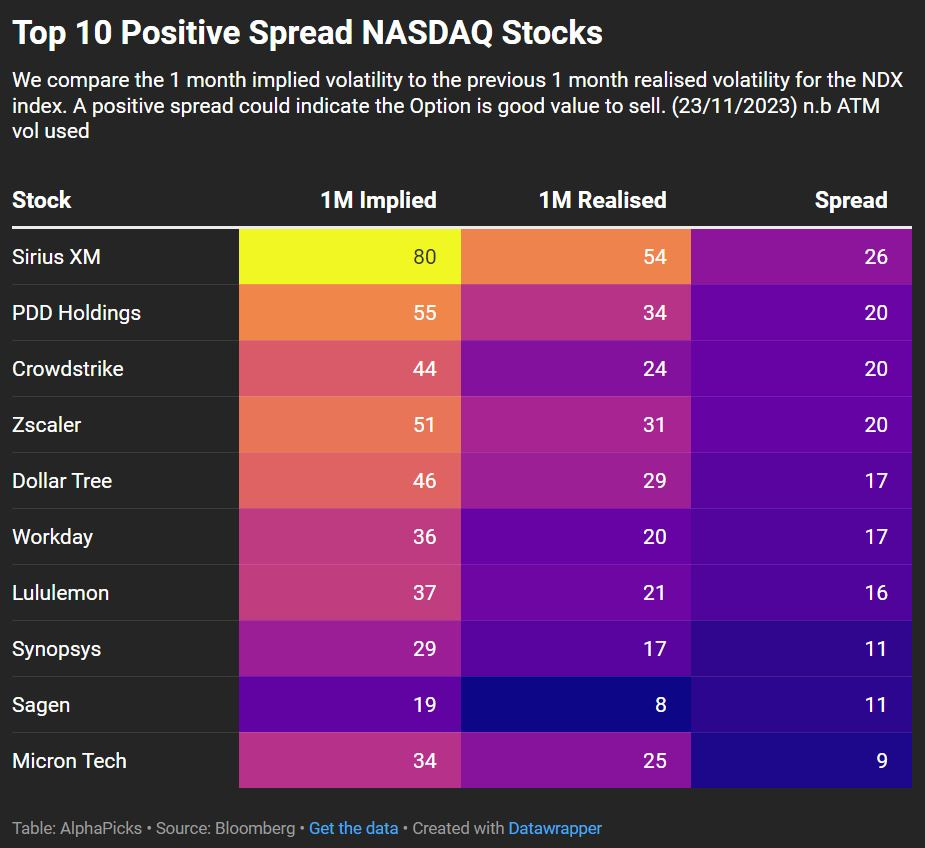
For example, we can’t see any financial results due out for Sirius XM in the next month. The spread of 26 is high, which puts this name on our radar for our strategy.
Implementation and risks
Most retail trading platforms that offer options will allow someone to both buy and sell a Put and Call. That’s technically all you need to put together a Straddle.
When buying an option, your max loss is the premium that you pay upfront. When selling an option, your max loss can be unlimited (if selling a Call). This risk needs to be understood.
The best place to target the strikes is at-the-money (i.e where the current share price is).
Most platforms will also show you the implied volatility. The tricky part is finding the realised volatility, for which you’ll need a more in-depth platform such as Bloomberg.
Fortunately, we can provide this access, and starting in January, we’ll be posting lists (like the above) of the largest positive and negative spread stocks. This will be on our Substack homepage, under a new tab. To access this data, you’ll need to be a paid subscriber (£4.99 a month):