Right Now, All That Glitters *Is* Gold
With a 24% gain in the past six months, gold is close to testing all-time highs. Here's the game plan.
Gold has benefitted from re-pricing Fed rate expectations and a portfolio hedge.
Technicals support a test of all-time highs, but the weekly candles show a more cautious picture.
We present three trade ideas depending on conviction.
As London walks in this Friday morning, gold trades at $2,040 per oz. This marks an impressive 6.1% gain over the past month and a 24% gain over the past six months.
With it only marginally away from the spot all-time highs posted last year of $2,075, it’s fair to say that gold is certainly glittering from the perspective of investors that bought into the precious metal over the past year.
Why is gold performing so well?
There are three main reasons that we put out there that have contributed to the strengthening of XAU/USD (gold). The first is the repricing of US Fed rate hike expectations.
As can be seen from the below graphic, yields across the board have fallen versus where they were a month and six months ago.
Even at the short end of the curve, the market is pricing only a 7.4% chance that rates will be at their current level. Rather, the probability of cuts between now and then make up the bulk of the expectations.
What has this got to do with gold? Given that the metal doesn’t provide any yield to investors, it has a correlation to weaken during times of rate hikes. This can be noted over the spring/summer and autumn of last year, when it fell to levels close to $1,600 as we endured swift hikes from the US Fed.
Given the shift in expectations over the past few months, it has provided a boost to the gold price. The potential for cuts and lower yields acts to bid up gold with less of an opportunity cost.
A second factor we flag is the rise in demand for gold as a portfolio hedge. We can’t be the only ones slightly puzzled by the entering of a bull market for the NASDAQ 100. Other markets seem to be having a care-free attitude to the economic backdrop.
For example, US CPI might have ticked slightly lower to 5% earlier this week, but Core CPI (stripping out food and energy) moved higher to 5.6%. We don’t think that inflation is going away and cite it as one reason why the odds of a US recession this year are still very much 50/50 in our eyes.
With that in mind, we feel smart money is moving into gold to protect against other assets that might be jumping the gun a little on optimism.
Finally, it’s important to note that gold trades as a currency, paired against another asset (e.g USD). XAU/USD has been able to move higher thanks to weakness in the USD. The Dollar Index is down over 10% from September highs, which naturally helps to pull XAU/USD higher.
This reason is correlated to the first one - namely lower Fed rate expectations. It’s shown well via the below chart:
What do the technicals tell us?
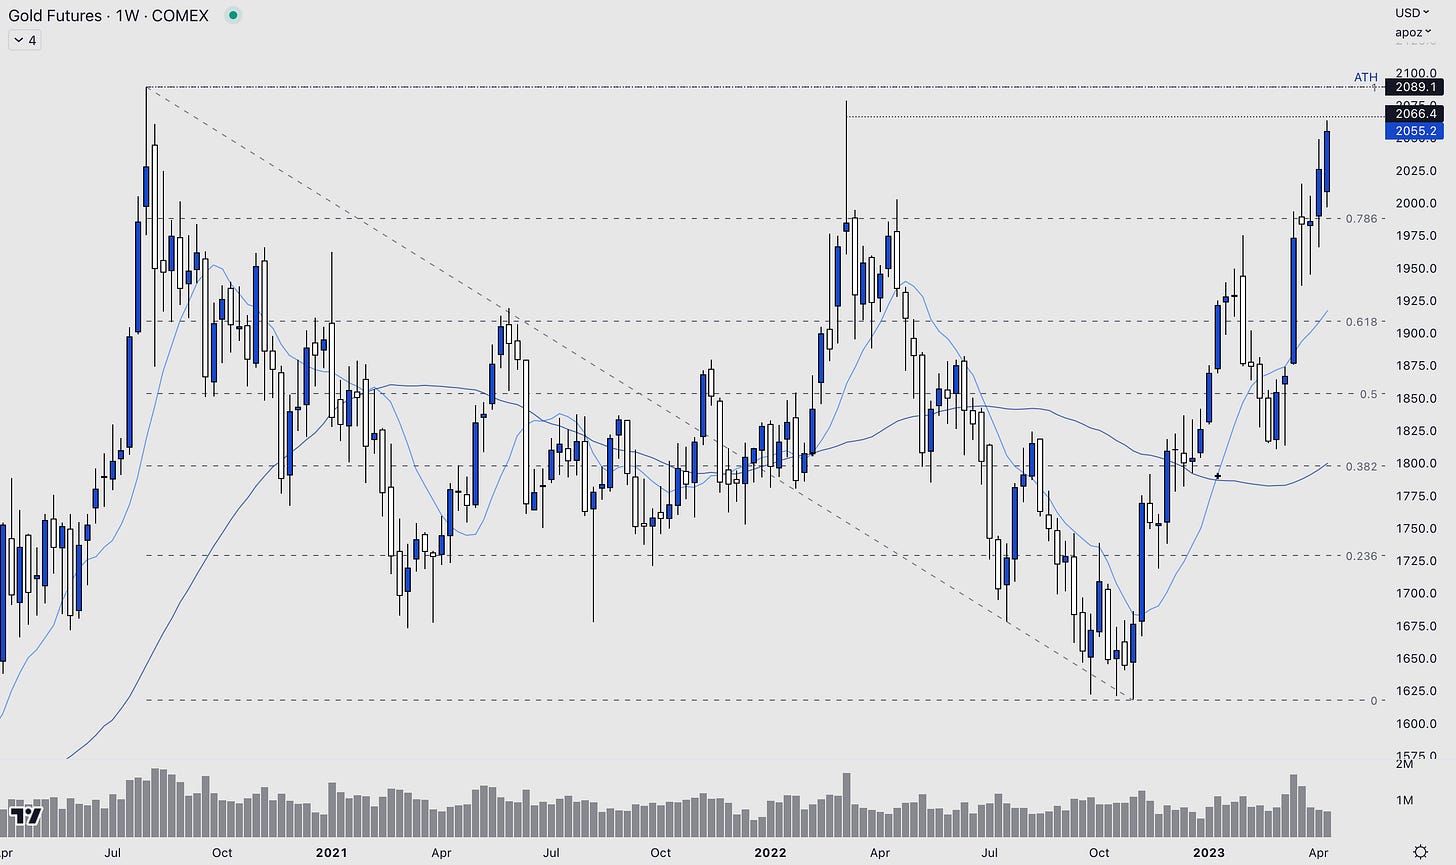
To give us a gauge on levels, we highlight both the futures chart on hourly candles and weekly ones.
On the hourly chart, the trend channel high comes in at $2,066, with a clean break above that making it likely to want to test the highs from last year of $2,075. A jump straight to $2,089 (the futures ATH) would seem to be a bit of a stretch in the short run.
However, the formation of making higher highs and lower lows does suggest to us that any corrective move lower down to the $2,030 mark would be bought up, with strong horizontal support (previously resistance) at the $2,002-$2,000 level.
Looking further out, the picture becomes more muted. The last two attempts to break and firmly hold above $2,000 over the past couple of years have failed.
On the weekly chart, $2,000 again appears to be key in the coming couple of weeks, to see if momentum can be maintained. One point to note versus the past occasions is that the weekly candle is more bullish, having not retraced much from the high of the candle wick.
As with the hourly chart, a break above the ATH would take us to unchartered territory, which is where fundamentals rather than technicals take charge.
Trade ideas
We polled our Twitter audience yesterday on where they thought gold would be trading in a months’ time. Remarkably, it was split 33% for each of the options (below 1980 / between 1980-2075 / above 2075).
As a result, we outline our favourite way to trade for each scenario;
BEARISH GOLD - Seagull Option
Sell a 1 month Call strike $2,050
Buy a 1 months Call strike $2,100
Buy a 1-month Put strike $1,975
Receive 0.16% premium
Next is a great setup for those that are neutral:


