This One Chart Is A Huge Recession Flag
Bond curve inversion is one thing, being inverted for the longest time on record is another.
The bond markets are useful for a variety of different things. They provide a way for Governments and corporates alike to raise capital. It provides a gauge of expectations for future interest rates at any point in time. And arguably one of the best uses for macro investors of the bond market is the finger-on-the-pulse it provides about investor sentiment in general.
One of the classic cases is when trying to predict when/if a recession will occur (in this case we’re focused on the US). For decades, investors have looked at curve inversion as a leading indicator that a recession is coming.
What’s curve inversion?
Normally, we expect that bills/notes/bonds issued by the US Gov to have a yield that slopes upwards as the tenor increases. For example, the yield on a 2 year bond should be lower than a 10 year bond (on the basis of a normal functioning economy with a growth horizon).
Curve inversion happens when you take a short dated and a long dated yield and find that the short term yield is HIGHER than the longer dated one.
In short, this tells us that the market is expecting interest rates to fall, which is usually as a result of the central bank trying to stimulate demand due to low/falling growth rates.
The chart you need to see
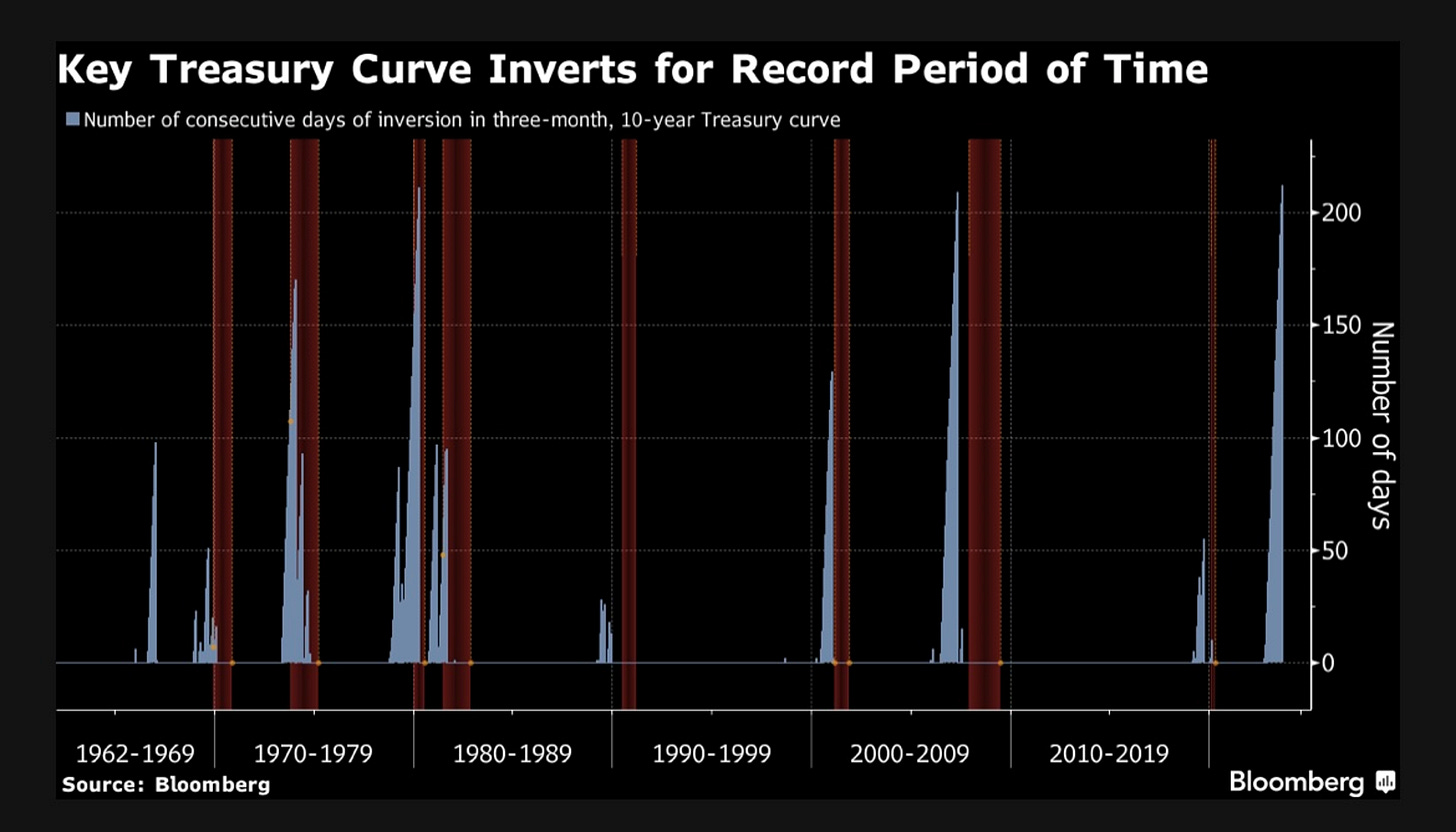
Below we flag up the spread between the 10 year bond and the 3 month bill. The light blue shows the number of days historically that it has been inverted, with the red showing recessionary periods.
The key statistic here is that the curve has now been inverted for 212 days straight, the longest on record. In the past, the longer the curve has been inverted for, the longer the recession has been that has followed.
In the rest of the article, we’ll discuss:
What other spreads (e.g 2’s/5’s) are telling us
Why the bond market is signalling something different to equities
If Treasury bills is the best place to hold funds right now


