

Trading This Crypto Move
What we're flagging as BTC takes out $100k.

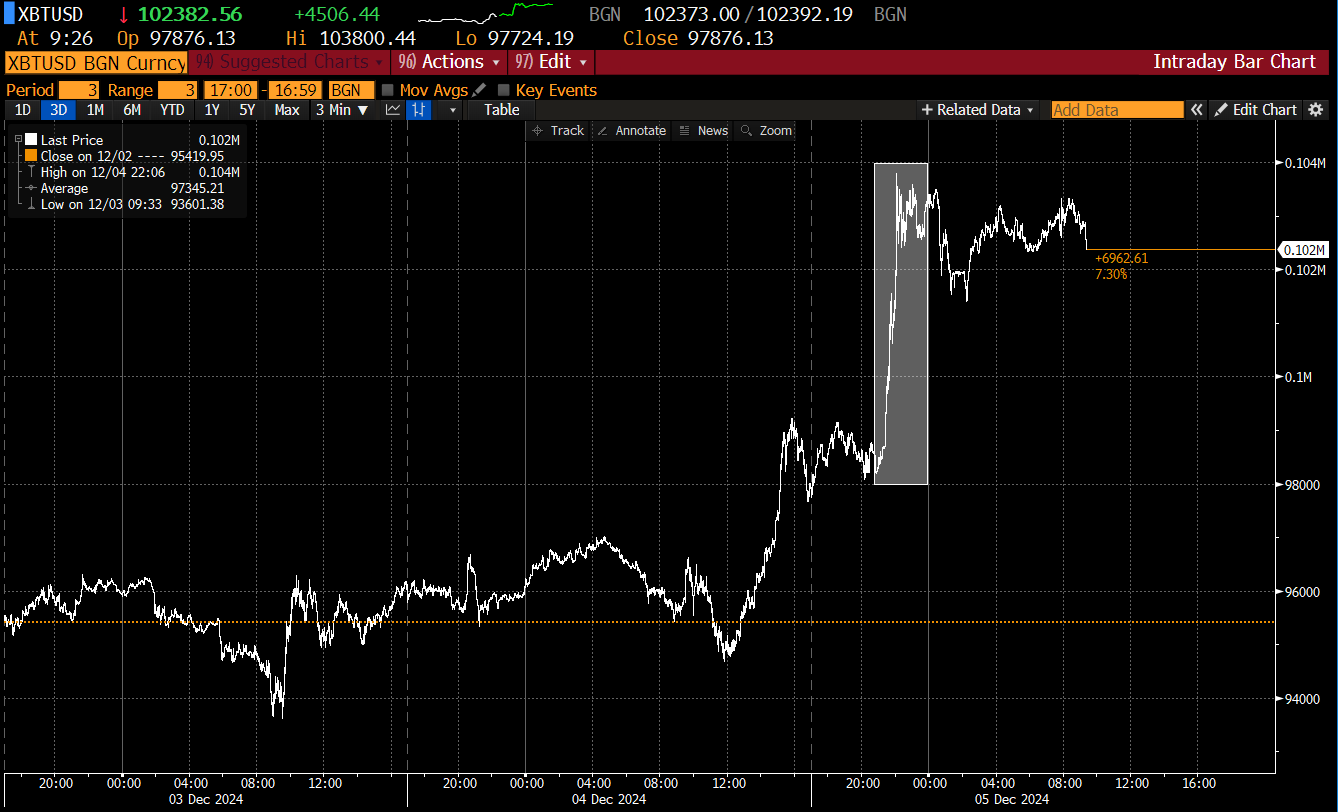
After flirting with taking out $100k for almost three weeks, Bitcoin finally broke above the mythical barrier in late Wednesday evening London time.
Despite us having cut our long BTC positions in late November, the move still interest us for several reasons. So today we wanted to point out some of the factors behind the pop, what we feel it means for crypto from here and how those still in can hedge and trade around this to protect profits.
Why It Rallied
The main news triggering another push higher was the fact that Paul Atkins has been selected to be the new SEC Chair. Atkins is seen as a much more pro-crypto man to have at the top table than the outgoing Chair Gary Gensler.
Trump’s pick of Atkins is another sign that he’s forming a pro-crypto assembly for his next stint in office, which bodes well for a regulatory environment that can support the further adoption of crypto in more mainstream forms as well as expanding the product set around crypto to further fuel trading volumes globally.
The other factor is the clean break and run past $100k up to $103k before finding some resistance. There’s indications that there was a lot of stop hunting going on, with likely sellers being forced to cut positions in a hurry on the break of $100k which helped to fuel a small short squeeze and push the price higher in the short run.
Price Discovery Mode
The vast amount of content being posted right now relating to BTC and crypto is poor at best. We’ve looked at the articles of people calling for $150k in six months, $200k next year etc etc and the specific price levels aren’t backed up by solid reasonings.
This is because BTC is in price discovery mode. It hasn’t been this high before, and has just traded through a mythical level that some never thought it would ever get to.
When an asset is in price discovery mode, it’s pretty pointless trying to do normal technical analysis. Rather, in these cases we turn to more momentum and volatility driven indicators.
For example, we’d consider using the Relative Strength Index (RSI). For those unfamiliar with this, it measures momentum and identifies overbought or oversold conditions, using a numerical figure between 0-100.
If RSI > 70, the asset might be overbought, suggesting a potential pullback. If RSI remains high but shows a bearish divergence (price rising, RSI falling), it could indicate weakening momentum.
Below shows BTC on top with RSI on bottom, and you’ll note that although it’s technically in overbought territory, it’s not as overbought as last month or from Q1 of this year.

Another useful indicator right now is looking at the options market. Recently, options trading was introduced on the Bitcoin ETFs, including the iShares Bitcoin (IBIT).
When looking at the options skew, Calls are favoured. Let’s break this down. If we looked to buy a 3 month at-the-money (ATM) call option on the ETF, it would cost us 13.41%. If we were to buy the same tenor and same ATM Put option, it would cost 12.49%. The more expensive price on the Call is what’s known as the skew. It can indicate more demand for Call buying, which as a sentiment check would indicate that investors see BTC trading higher over the course of the next few months.
Put:

Call:
