

Using Prospect Theory In Trading
How to beat your unconscious biases

If we gave you a choice of either taking a guaranteed £50 profit from a trade, or having the 50/50 shot at making £100, which would you choose?
Or if we gave you the choice of investing yourself and making £100, or paying a fund manager £100 for him to make you £200, which would you choose?
These scenarios, and other similar ones, are explained out via behavioural economics. More specifically, using prospect theory, developed by the late, but great, Daniel Kahneman and Amos Tversky.
Here’s why you need to understand inherent human biases in order to become a better trader/investor.
Before we get into the article, you can become a premium subscriber with us for just $20 a month. This provides you full access to our weekly articles without a paywall, including our flagship Monday trade ideas and full access to what we are buying and selling in our Global Asset Portfolio.
What Is Prospect Theory?
At the core, prospect theory is a behavioural economic theory that describes how people make decisions involving risk and uncertainty, particularly in situations involving potential losses and gains.
Within the theory, there are some key concepts.
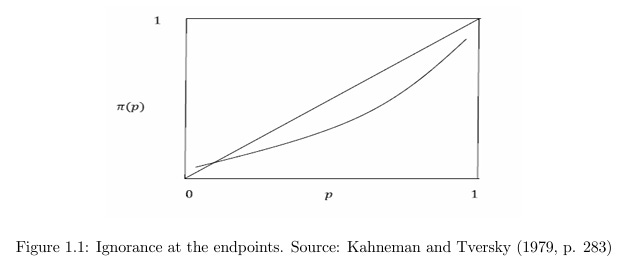
Loss Aversion
The below diagram illustrates the differences we feel of losses versus gains:

Notice that the gradient in the bottom left quadrant is steeper to begin with than that in the top right. This reflects the loss aversion bias that we all have. The value function gradient is steeper for losses than for gains. As a result, we are much more sensitive to losses than gains of the same magnitude.
We can think of this in action with an investing scenario. Let’s say you invested in two ETF’s a couple of years back. One was focused on China exposure, the other on the US. Fast forward to today, and you’d likely be down on the China ETF, but up on the US one.
For arguments sake, let’s say you are down 40% on China but up 40% on the US. Which one bothers you the most? If we’re being honest, the 40% loss on China stings far more than the pleasure of the 40% gain from the US.
Investors tend to prefer avoiding losses rather than acquiring equivalent gains. According to studies around this topic, the pain of losing is psychologically about twice as powerful as the pleasure of gaining.
Diminishing Sensitivity
Another feature of the diagram is the shape of the value function. It’s concave for gains (indicating diminishing sensitivity) and convex for losses. This means that the subjective value increases at a decreasing rate for gains and decreases at a decreasing rate for losses.
Put another way, the impact of an additional gain falls as the overall gain increases, and the impact of an additional loss falls as the overall loss increases.
So let’s go back to our portfolio of the two ETF’s. You log back in to your account tomorrow and see that the China fund has dropped from 40% to 41%. The impact of this 1% to your emotions is far less than a fall of 1% a year ago, when the fund was less underwater.
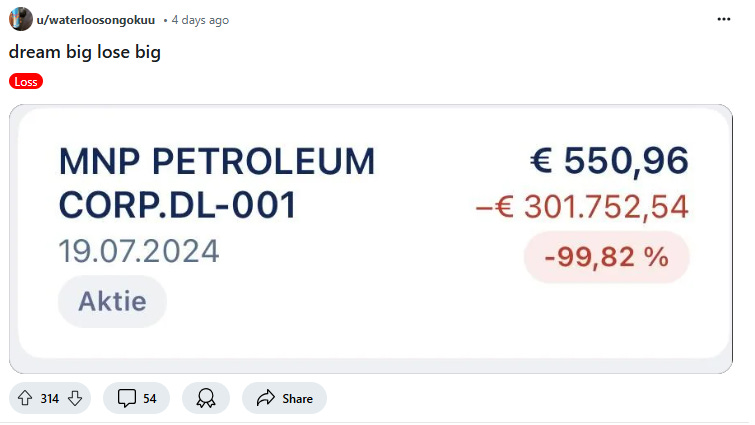
This ties in with the reference point of your investment. Rather than considering the absolute value of outcomes, people often assess gains and losses relative to a specific reference point, which is typically their current state or expectations.
Imagine if the below investor checked his account again and his remaining €550 had fallen to zero. Given he’s down over €300k, it might not mean that much. Yet if he had invested €1k and his €550 fell to zero, the emotional impact would likely be larger, as his reference point is from €1k not €300k.
The reference point acts as a baseline, influencing whether an outcome is perceived as a gain or a loss. As another example, if you expected your US ETF to rise by 50% but it only increased by 40%, you might perceive this as a loss relative to your expectation, despite it still appreciating in value.
The Framing Effect
At the beginning, we posed this scenario:
If we gave you the choice of investing yourself and making £100, or paying a fund manager £100 for him to make you £200, which would you choose?
This is an example of dealing with the framing effect. The concept emphasizes how the way choices are presented or "framed" significantly influences decision-making. According to the theory, individuals’ choices can be dramatically altered by the way information is structured, even if the underlying facts remain the same.
The bias we have is to focus towards loss aversion, where as we explained earlier, the fear of losses typically has a greater psychological impact than the anticipation of gains. Consequently, the framing of options as gains or losses can lead to different risk-taking behaviours.
In our example, most people would choose to invest themselves to make £100, even though paying a pro £100 to make you £200 would give you the same monetary outcome at the end. Yet the framing effect means that we dislike the concept of ‘losing’ £100 to the fund manager.
The Balance Of Probabilities
People tend to overestimate the likelihood of rare events and underestimate the likelihood of moderate to high probabilities.
Further, when people consider the chances of an event happening, they often don't process very small or very large probabilities accurately. There seems to be a minimum threshold for how small a probability can be for people to consider it at all. Similarly, there's a maximum threshold below certainty, beyond which people treat high probabilities almost as if they were guaranteed.
This is visually depicted in the below chart showing the actual straight line probability outcome versus our human bias on the probability of an outcome:
Take as example the movements in USD/JPY over the past few years. It has been in a strong uptrend, based on factors including the interest rate differential between the US and Japan.
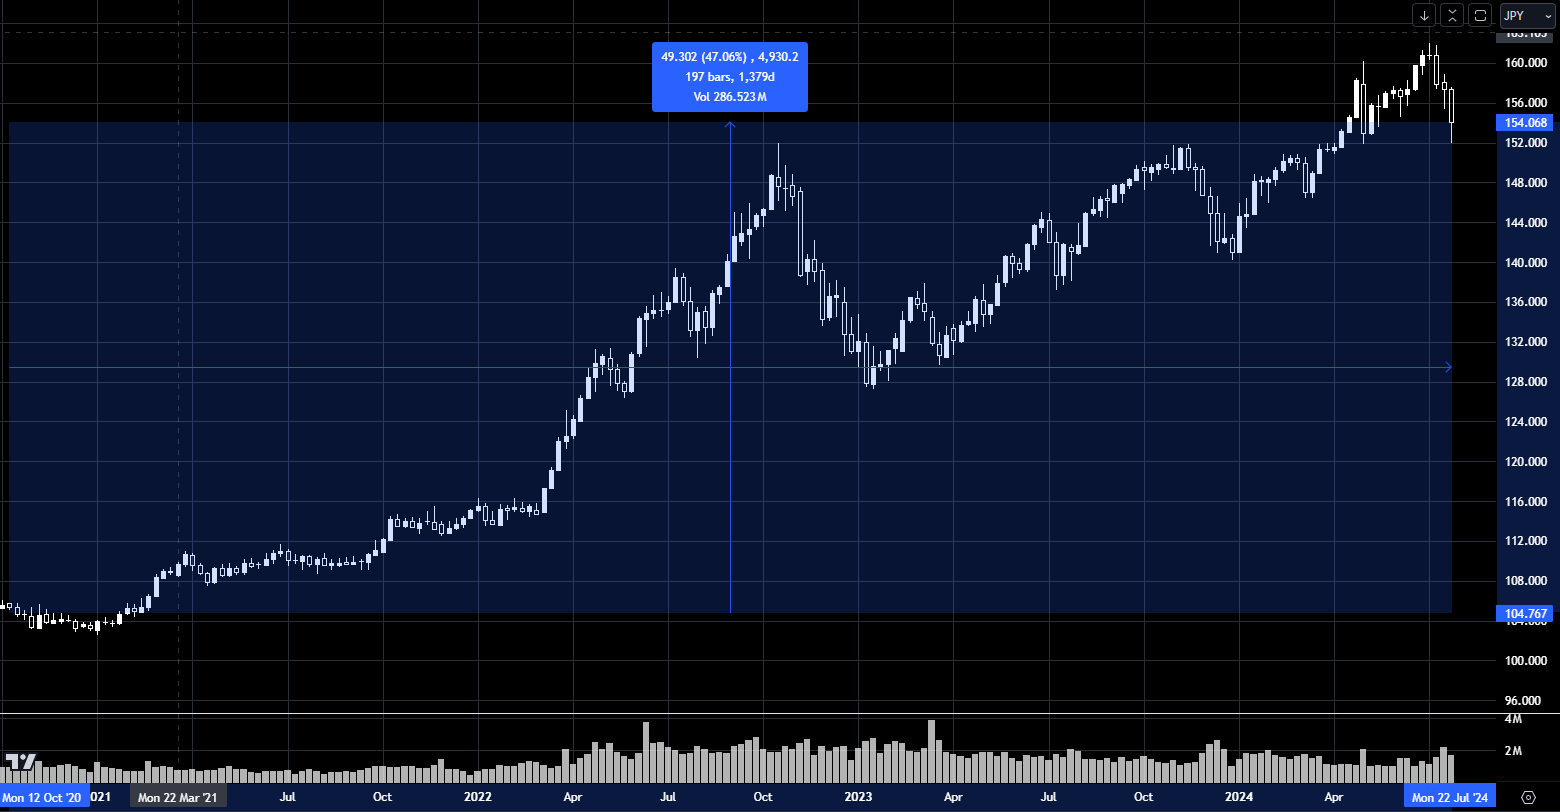
Yet what have many traders (ourselves included), been guilty of at least once over this time period? Shorting the pair.
Even though the high probability outcome has been a grind higher, we have overestimated the small probability of other outcomes, such as MoF intervention, BoJ changing monetary policy, etc etc.
Even if the probability of an event can be determined, as humans we still have a bias for avoiding any uncertainty. In the case we posed at the beginning;
If we gave you a choice of either taking a guaranteed £50 profit from a trade, or having the 50/50 shot at making £100, which would you choose?
Most people would choose to take the guaranteed £50, even though the probability outcome of the second is £50.
Actionable Takeaways
Bringing everything together, we feel there are some key lessons to try and negate the biases we all have.
Manage and accept risk
Set your stop loss and take profit levels with a minimum of 2:1 risk/reward to ensure that even though you have risk, you set a maximum threshold. This avoids holding on to positions that are losing and falling into the trap of diminishing sensitivity.
Accept that you need to risk some capital to stand to make a profit. The quicker you can accept that risking a loss is the only way to actually enter the market, the quicker you’ll be able to move forward without fear taking over every trade.
Play for high probability outcomes
Don’t underestimate the likely outcome in a given investment. If a market has been trending higher for the past few months, momentum would indicate to go long. Avoiding trying to always take the contrarian route (going short in this case) should help to minimise overestimating the small outcome route.
Deal with loss aversion
To better handle aversion to loss, if might be easier to trade certain ways. For example, buying Options allows a trader to know up front the full cost of entering a trade via the premium paid. Alternatively, trading without leverage allows losses to not multiply as fast, helping to avoid emotional and panic driven reaction should a swift negative move happen in the market.
Define goals and performance metrics
There will always be an investor or fund that outperforms you over a period of time. Avoid this referencing bias, which could often see negative emotions come through.
Rather, have a clearly defined benchmark to track yourself against. Or for absolute performance, set a rate of return you are targeting over the course of a year.