

“It’s December 20th. Another bruising session on Wall Street has brought an already difficult year closer to an ugly conclusion.
The Nasdaq is down 19.5% from its late-summer highs, flirting with bear-market territory. Tech stocks, previously the pillar of the equity bull market, are leading the decline. The Fed has just raised rates again this year, a 25bps move, despite widespread calls from President Donald Trump and others to hold rates. Despite this pressure, the Fed Chair moved ahead with the committee’s decision. Being the December meeting, the Summary of Economic Projections (SEP) was published alongside the rate hike, signalling further hikes in the new year.
Washington is hardly helping matters. The president has been openly critical of the central bank’s approach, while the prospect of a government shutdown threatens to complicate an already uncomfortable year-end.
The UST yield curve has continued to flatten as the spread between long- and short-end rates tightens. Asian equities have been at the core of the recent tech selloff, with $5.2tn in market value wiped out for the year and the MSCI Asia Pacific Index down 22% YTD. Even with the pain in the build-up, December has been one of the worst months for US equities in decades, driven by a Fed perceived as overly hawkish, growing tensions between the US and China after accusations of espionage and intellectual property theft came to light, and increasing pressure on the Fed’s independence.
Sentiment is bleak, by any measure.”
For readers who have spent the past several weeks watching the AI trade unravel, UST yields climb, and the Federal Reserve turn increasingly hawkish, the reflection above may sound familiar. It could easily be a dispatch from the closing weeks of 2026.
But seasoned market participants may have recognised the setting. The date is Thursday, December 20, 2018.
Eight years later, investors are confronting an eerily familiar collection of risks and sentiment. A hawkish Fed, a technology-led equity selloff, geopolitical tensions between the US and China, and another government funding deadline.
The resemblance is striking, but whether the outcome (a recovery) will be anything like 2019 is a different question. The comparison here isn’t about identical economic conditions, but rather the deterioration in risk appetite and confidence as markets head into year-end.
It’s worth spending this note looking at where the parallels to 2018 hold today, where they differ, and whether we can use the 2018 episode to establish the conditions under which the current correction is either a buying opportunity or the start of a broader repricing.
Where the Parallels Are Strongest
There are overlapping themes and angst from 2018 and today, but it is best to separate these into broader forces.
The Fed’s Hawkishness and Market Tolerance
Federal Reserve dynamics offer an interesting parallel, although the mechanics have reversed. Back in 2018, December’s interest rate hike was the fourth that year, taking rates to 2.50%, and it came amid concerns about slowing growth and weakening equity markets. The December hike was fully priced, as it is in today’s markets. However, the market expected a pause in tightening in 2019, and Powell delivered a more hawkish outcome (a blunder, to say the least).
Eight years later, the Fed is testing the market’s tolerance for higher rates, with Waller’s comments early last week about a 50bps hike kicking off a move higher in short-end yields. Rates are considerably higher than they were in 2018, already at 4.00% and set to tighten further next year.
In 2018, investors expected fewer hikes than the Fed projected. Today, markets expect more tightening than the Fed’s own forecasts (September’s SEP) imply. The direction has reversed, but the underlying uncertainty remains. How far can policymakers push rates before financial conditions force a rethink? It’s a useful analogy for “sentiment and spice,” as one friend/client described it.
Tech Becoming a Liability
As is the case with many bull markets in recent decades, tech has been the driving force. The 2018 parallel holds true today in that regard. But market forces can work in both directions, and tech became the source of weakness for markets eight years ago. The current AI trade poses a similar problem, but with greater concentration in companies tied to one investment cycle this time around.
Monday’s (November 16) selloff took the Nasdaq further into correction territory. NVDA earnings tonight have helped a little, and an Anthropic IPO (Thursday) only adds to the gravitas of this week.
Although there is a high concentration in tech names within the indices, there is a distinction to be made in the parallel. So far, the damage at the index level has been relatively contained. As John Authers and Richard Abbey put it earlier this week, “In five weeks since its October 6 peak — a selloff that began before the latest revelations about Huang — the chipmaker has lost more than $1.8tn in market value, all with surprisingly little impact on the broader market.”
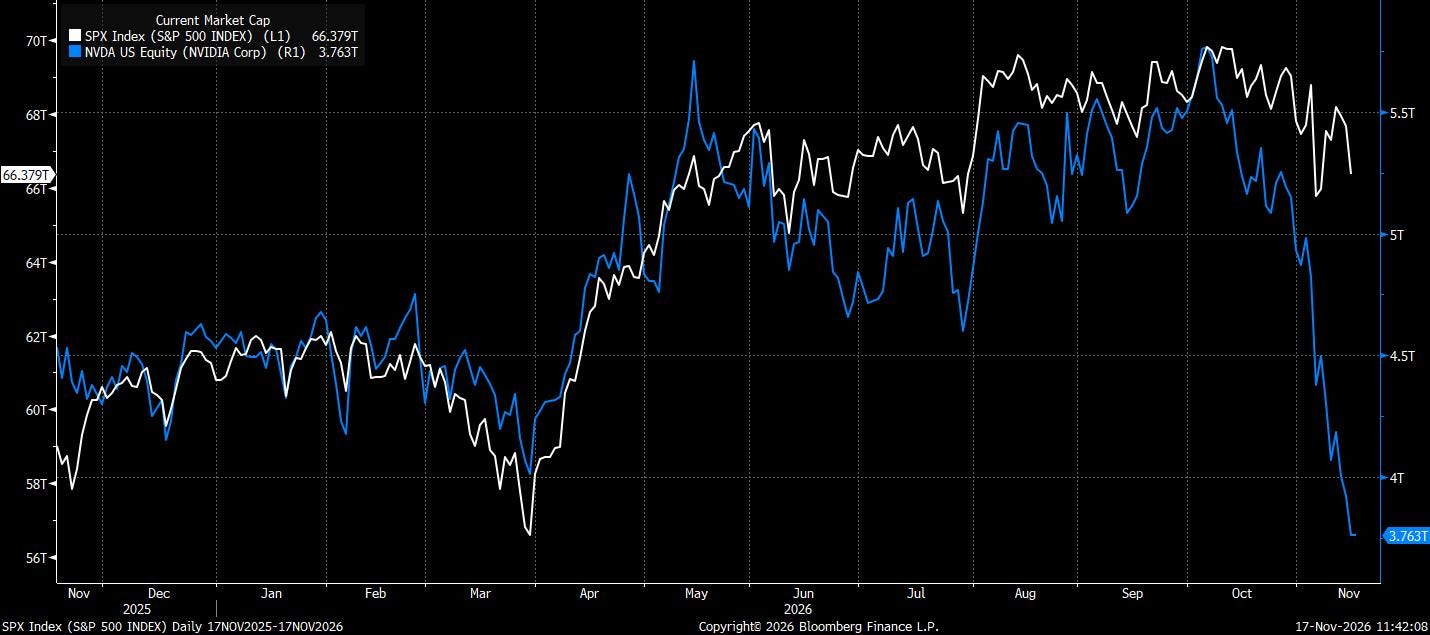
Perhaps there is more breadth to this bull market than it’s been given credit for. But that doesn't mean a disappointment in earnings, downward revisions to capex expectations, or further pressure from funding conditions won’t turn a sector-specific unwind into a broader issue.
One aspect that could further weigh on equities is Washington, leading us nicely to the next parallel.
Washington Adding to the Uncertainty
In 2018, a trade war with China fed concerns about slowing global growth. A direct parallel to this was actually more accurate last year, when President Trump launched global tariffs, leading to a back-and-forth of economic warfare between America and China. But there is certainly a similarity to the new tensions brewing, all stemming from the fallout and drama around Nvidia.
Jensen’s compromise has given the China hawks in Washington all the fuel they need to push restrictions in the name of national security. That pressure was focused on semiconductors on Monday, as the market reassessed how much non-China revenue is actually China revenue via backdoor routes.
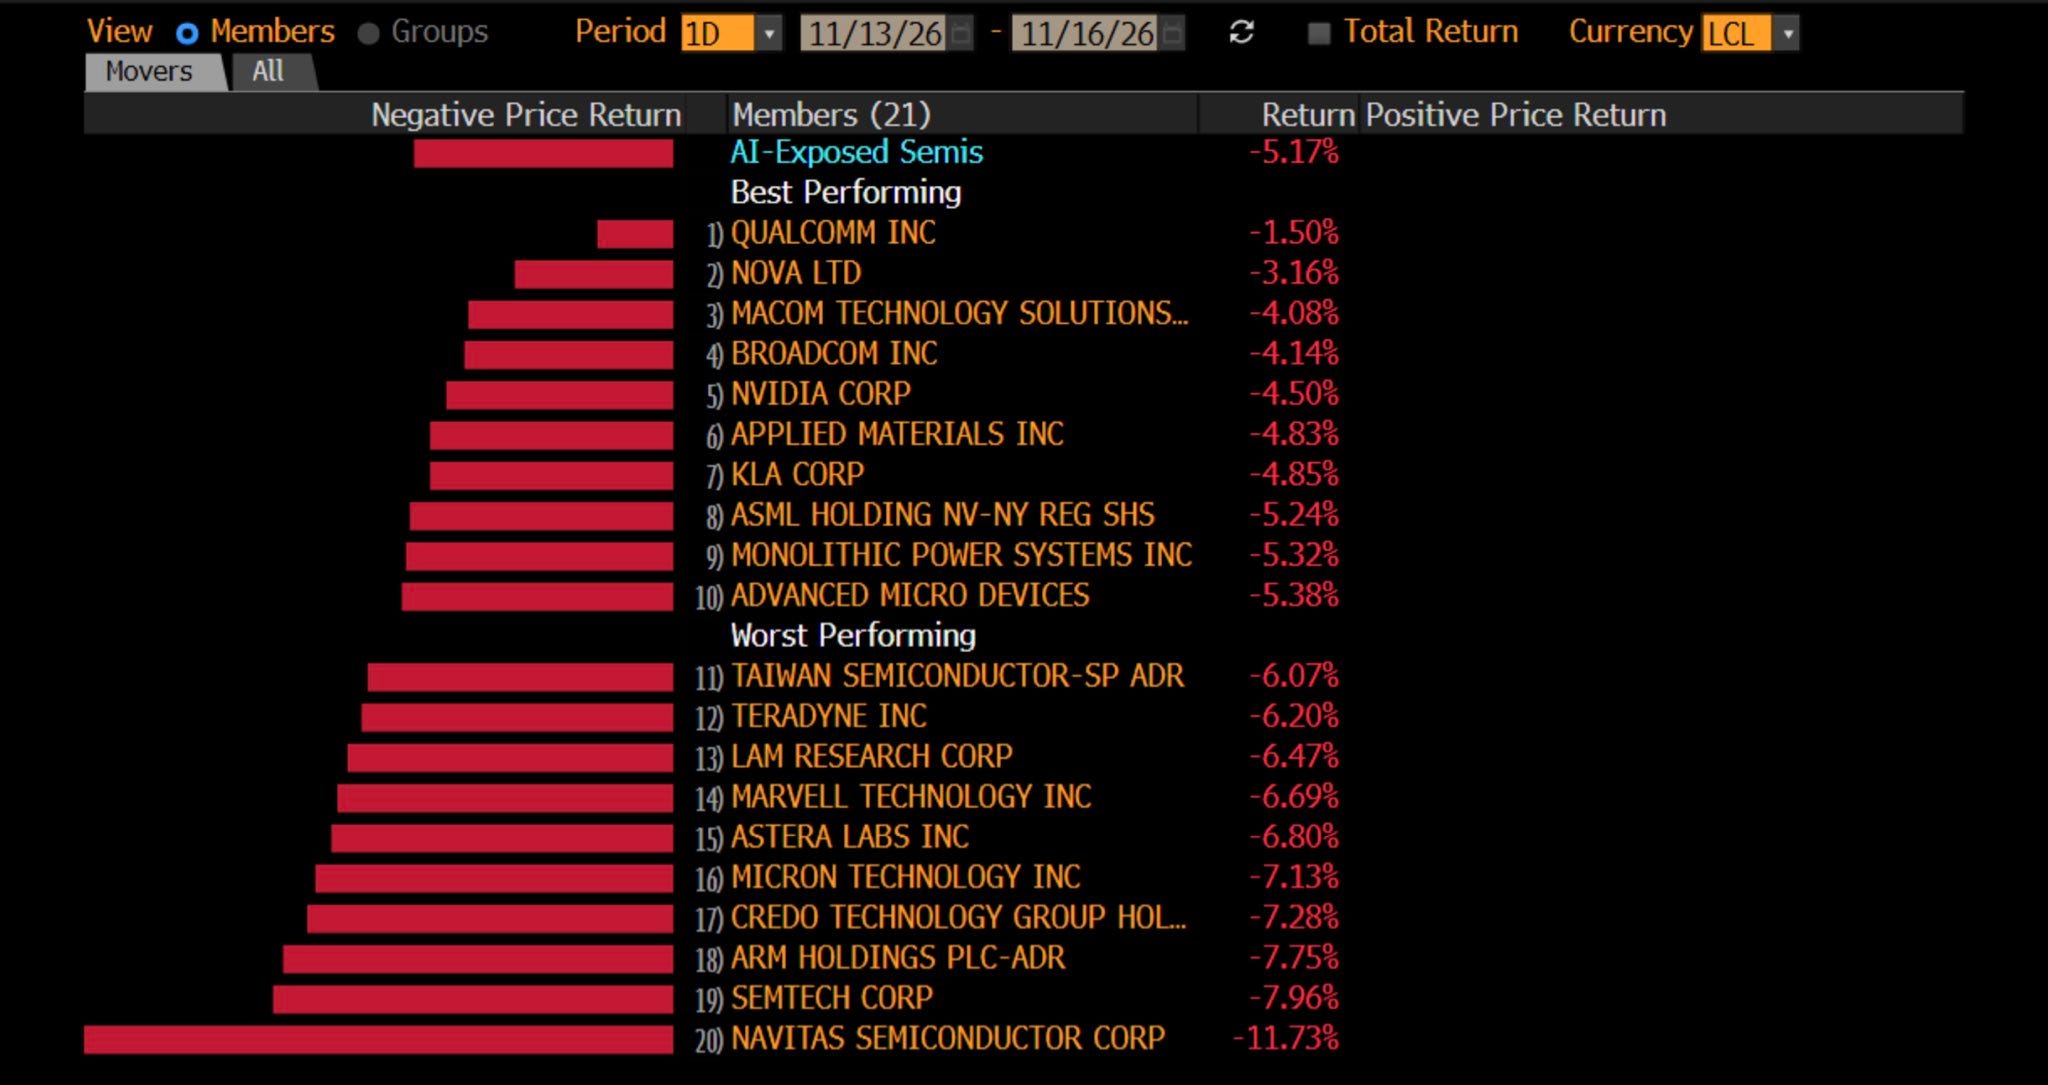
The Commerce Department issued an interim rule this week requiring data centre operators in Singapore, Malaysia, Thailand, Indonesia, and Brazil to obtain US government licenses before exporting advanced AI chips (including Nvidia’s) to customers in those countries.
Restrictions on advanced chips and uncertainty around the industry’s regulatory environment are likely to increase in the coming weeks, all weighing on a significant share of equity-market performance. As we wrote on Monday, “Huang was the industry’s most prominent opponent of US chip export controls, and his exit removes that lobbying force.”
All three forces above make the comparison compelling, but they explain why the parallels look similar, rather than arguing that the outcome will be the same. We all know the saying well: “History doesn’t repeat itself, but it does rhyme.”
Where They Differ
Of course, one must spend time analysing where this parallel differs, and in doing so, we can gather more takeaways about the sentiment we find ourselves in.
Bonds Tell a Different Story
Perhaps the most important distinction comes from Treasuries. As equities sold off in 2018, bonds held up as their useful hedge and rallied during the final quarter. The 10-year yield fell 50bps from a November high of 3.24% to 2.74% by Christmas Eve, reflecting growing market concerns over economic growth and the Fed’s tightening cycle.
For much of 2026, yields have moved in the opposite direction to 2018, pressuring markets as the 10-year surpassed the 2023 high and reached 5.30% at the start of October. Today, higher yields are contributing directly to the pressure on equities. That changes the nature of the shock, primarily because the variable that has changed in the current dynamic is inflation.
The Market Hasn’t Capitulated
As markets closed up for the holiday on Christmas Eve, the S&P 500 had fallen almost 20% from its September high. This was a selloff well beyond technology, with deteriorating growth expectations and financial conditions weighing on sentiment across the board.
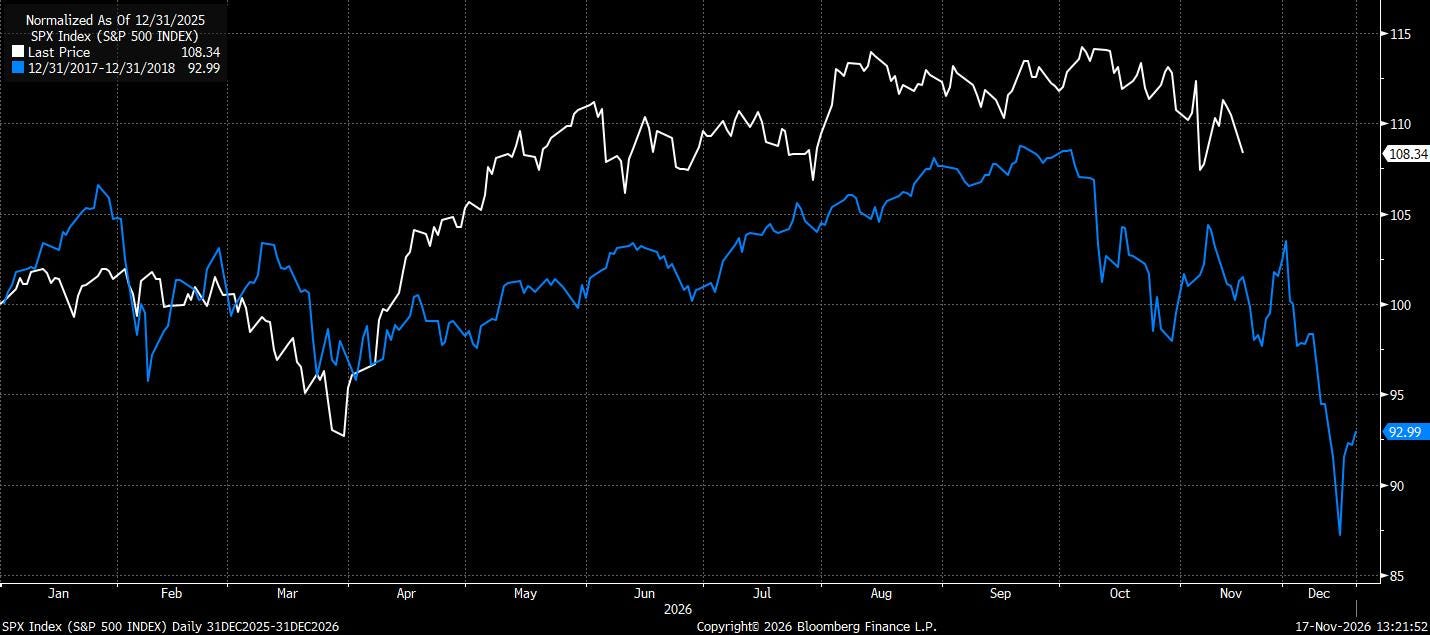
Today’s equity market weakness is far less advanced at the index level. The S&P 500 is still very much positive for the year, supported by resilience outside the largest tech names in recent months, whereas 2018 returns were far less visible before the downturn. The damage below the surface today is much more pronounced, but a broad-based capitulation has yet to materialise.
Positioning, however, complicates this dynamic. Many headlines and insights suggest funds have exhausted their capacity to add risk, while losses and tighter risk limits are forcing reductions in exposure as we head into the year-end. With Thanksgiving approaching and Christmas markets next month, liquidity will continue to thin and could exaggerate selling pressure, even without a move lower in fundamentals.
On the flip side, reduced positioning and crowding in tech names allow a mean reversal if catalysts come out on the correct side for investors. Nvidia’s earnings passed (though so far have failed to ignite any significant share recovery) and Anthropic’s mega IPO could provide the catalysts to aid or sour sentiment.
So this may not be a like-for-like example in equities, but it is a convincing one in terms of market psychology and sentiment. There is still plenty of room for capitulation or a position-driven recovery.
Inflation Changes the Fed’s Reaction
One of the clearest differences in the dynamics is inflation. In 2018, the Fed was criticised for tightening into deteriorating conditions, while today, inflation pressures could constrain the central bank’s ability to provide relief even if equities weaken.
In 2018, headline inflation stood at 2.2%, with falling energy prices helping moderate price pressures. The December hike was subsequently criticised as an unnecessary tightening into weakening financial conditions, and policymakers had sufficient flexibility in 2019 to correct course as growth risks intensified.
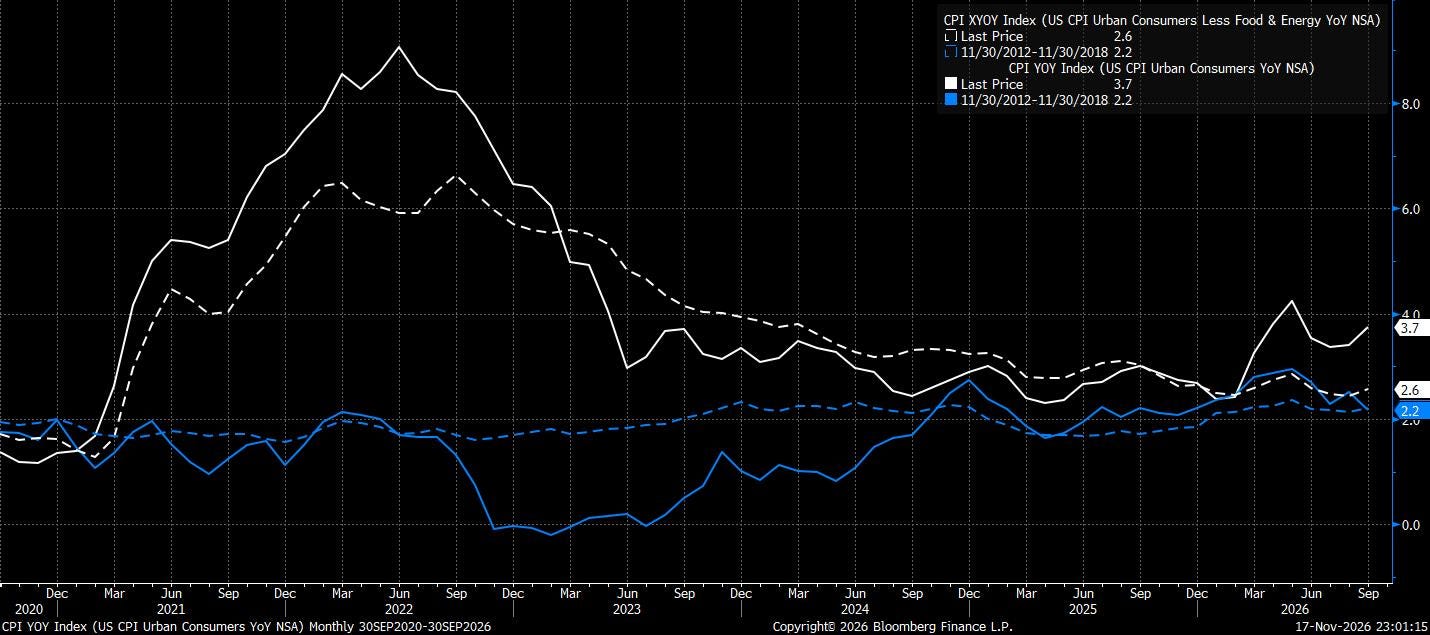
Today, headline inflation runs much hotter and has been the Federal Reserve’s Achilles’ heel for years. Geopolitical issues can further drive supply-side price pressures (Trump-Xi-Putin meeting this week, for better or for worse), and the committee faces a tougher trade-off between containing inflation and preventing an economic slowdown. This creates a far more precarious situation than eight years ago, and the negative knock-on for equity investors is that stocks can fall substantially without generating the policy response that helped rescue markets in 2019.
Yet here, there is a potentially self-correcting mechanism. A sustained deterioration in the AI investment cycle could reduce demand, ease inflation, and bring UST yields lower, creating room for a less restrictive policy. But in this scenario, we believe the AI trade would be far from the leader in any recovery.
The Turning Point
That’s the thing about 2018: it was painful across assets at the time. Sentiment was similar to today, but the early-2019 reversal made it an interesting case study.
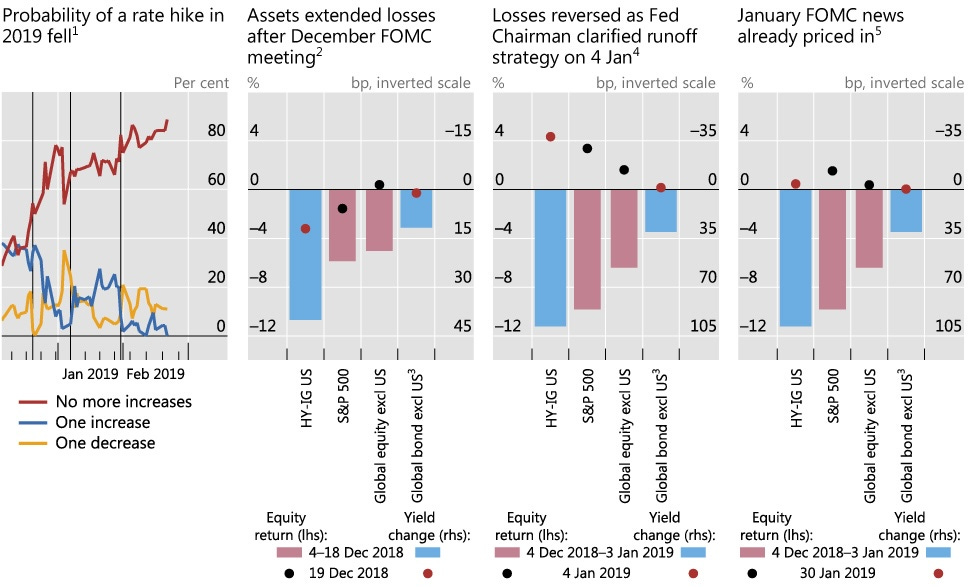
2018-19 Turning Points
It was a Jerome Powell blunder at the December 19 FOMC meeting that started the capitulation, but Powell also sparked the recovery.
December 19, 2018: The Fed raises rates and maintains its balance-sheet runoff, leaving markets concerned about excessive tightening.
December 24, 2018: The S&P 500 hits its low, just shy of a 20% peak-to-trough decline.
January 4, 2019: Powell signals flexibility on both rates and the balance sheet, helping reinforce the recovery in risk assets.
January 30, 2019: The Fed formalises a more patient approach. The market recovery gathers momentum.
As the global economic outlook remained unsettled, monetary policy shifted in January. More accommodative signals from central banks in major economies set the tone for a market rally that began in January and erased December losses. A phase of renewed optimism began.
What’s Needed in 2027 for a 2019 Repeat
The 2019 recovery was built on several developments arriving in relatively quick succession. Most importantly, the Federal Reserve did not need to deliver a rate cut to restore confidence; a willingness to pause tightening and acknowledge deteriorating financial conditions was enough to change expectations. The S&P 500 gained almost 14% in the first quarter, months before the first rate cut in July.
The shift from the Federal Reserve also came against a more forgiving macro backdrop. Price pressures moderated, giving policymakers the room to respond to weaker growth without jeopardising a mandate. Fiscal stimulus and accommodation were also seen around the globe from the likes of China and the ECB/BOJ.
For something similar to be delivered in 2027, several conditions would likely need to align, given that the Federal Reserve is constrained in its ability. Inflation would need to moderate sufficiently for rate expectations to turn lower, allowing UST yields to fall and providing relief to equity valuations. There is a plausible path to such an outcome, but it is a considerably narrower one than in 2019.
A Year-End Framework
The temptation with historical comparisons is to assume that a familiar set of conditions will produce a familiar outcome. But 2018 had a solution that does not look possible in today’s market. The Fed are unlikely to find itself with ammunition to ease conditions come the new year, shifting policy towards something considerably more supportive. That’s the missing ingredient today.
However, there are catalysts that can ease pressure before sentiment gets to that of the final weeks of December 2018, but the bar is high…