Disinflation vs Reflation - Where Next For The US?
We team up with Caleb Franzen to debate US inflation after the data release earlier this week.
A healthy divergence in views on key topics can provide an unbiased reader with a wealth of information to then be able to make their own judgement call.
On Tuesday, US CPI inflation slowed from the prior reading of 3.4% to 3.1%. However, this was higher than the expected reading of 2.9%.
What does the current information allow us to extrapolate about the future? We present our case for inflation rising in the coming months, with Caleb Franzen taking the other side.
For those who don’t know Caleb, he’s the founder of Cubic Analytics. Subscribe to his Substack and join 10,000 readers for weekly analysis on macroeconomics, the stock market, and Bitcoin.
At the end of the piece is a poll on what you think. Please cast your vote, and we’ll share the results.
Caleb Franzen: Disinflation
I recognize that I’m speaking to a new audience, so I’d like to take a brief moment to highlight the major calls that I’ve made regarding inflation dynamics.
In May 2021, when headline CPI was +4.1% YoY, I predicted that inflation would reach +6% to +10% YoY. During the 2nd half of 2021 and the majority of 2022, I used a data-driven approach to say that inflation would stay elevated & require a significant response from the Fed, in what I called Powell’s “Volcker moment”. In December 2022, upon the first evidence of disinflation in Median CPI, I formally predicted that disinflation was going to be the predominant theme going forward.
I’ve also been wrong on inflation, notably believing that inflation would be sticky during the 2nd half of 2022, until I eventually changed my mind based on the weight of the evidence.
Thankfully, the January 2024 CPI data reaffirms that disinflation is intact.
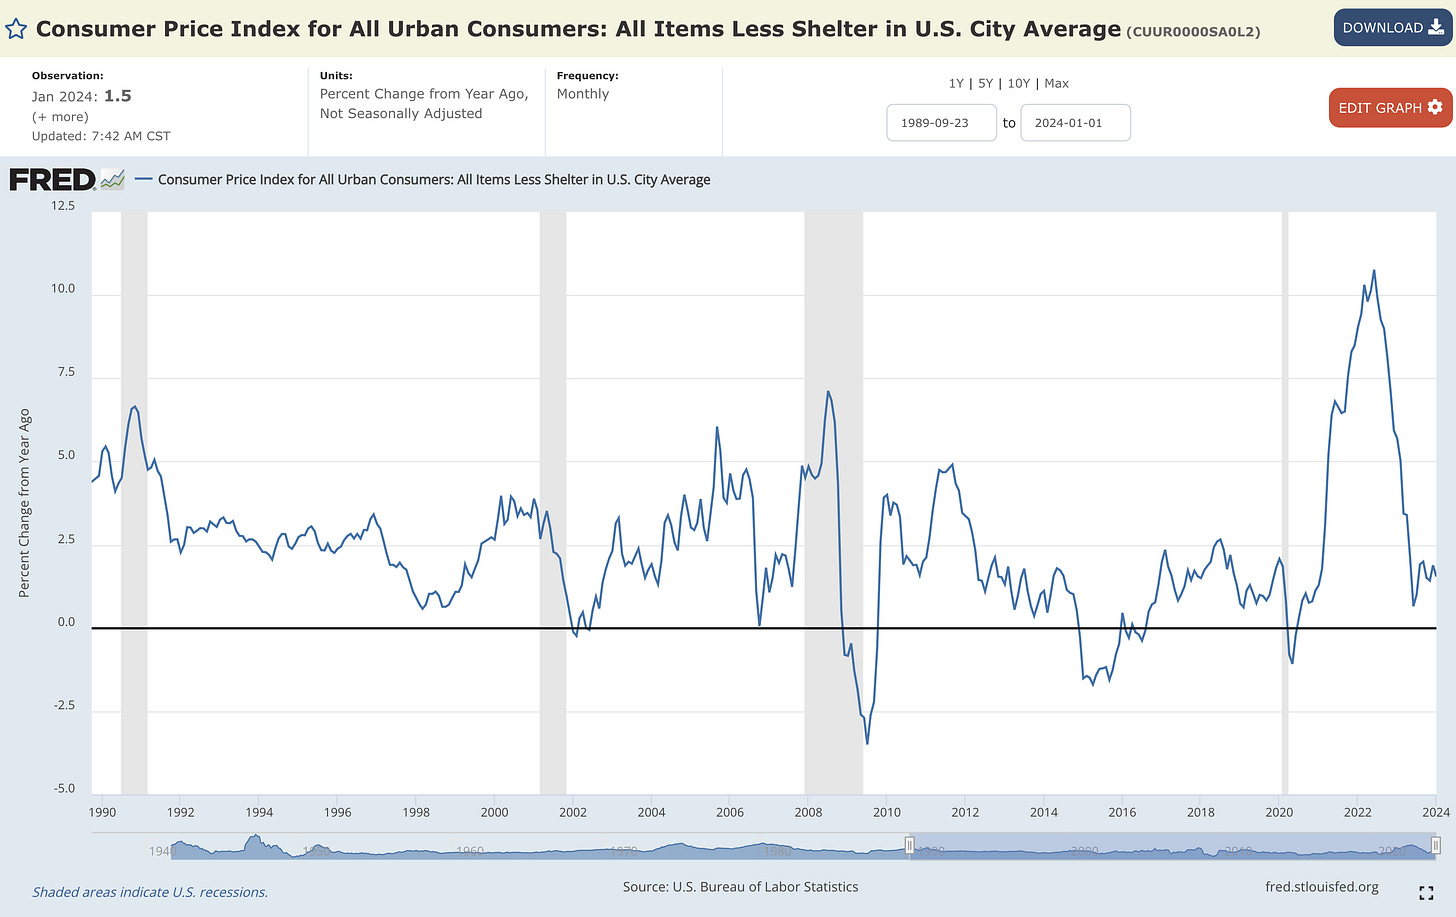
While the focus of this report is centered around where inflation is going to go next, I want to take a brief moment to highlight my favorite chart from the January data…
Headline CPI excluding Shelter on a YoY basis
There are two takeaways from this chart:
At +1.5% YoY, the aggregate inflation rate of all other components within the CPI is below the Federal Reserve’s target & within the historically normal range.
The +1.5% YoY result was lower than December’s result of +1.9%, further proof that disinflation in the broad-based components of CPI is intact.
Correlating inflation to the labour market
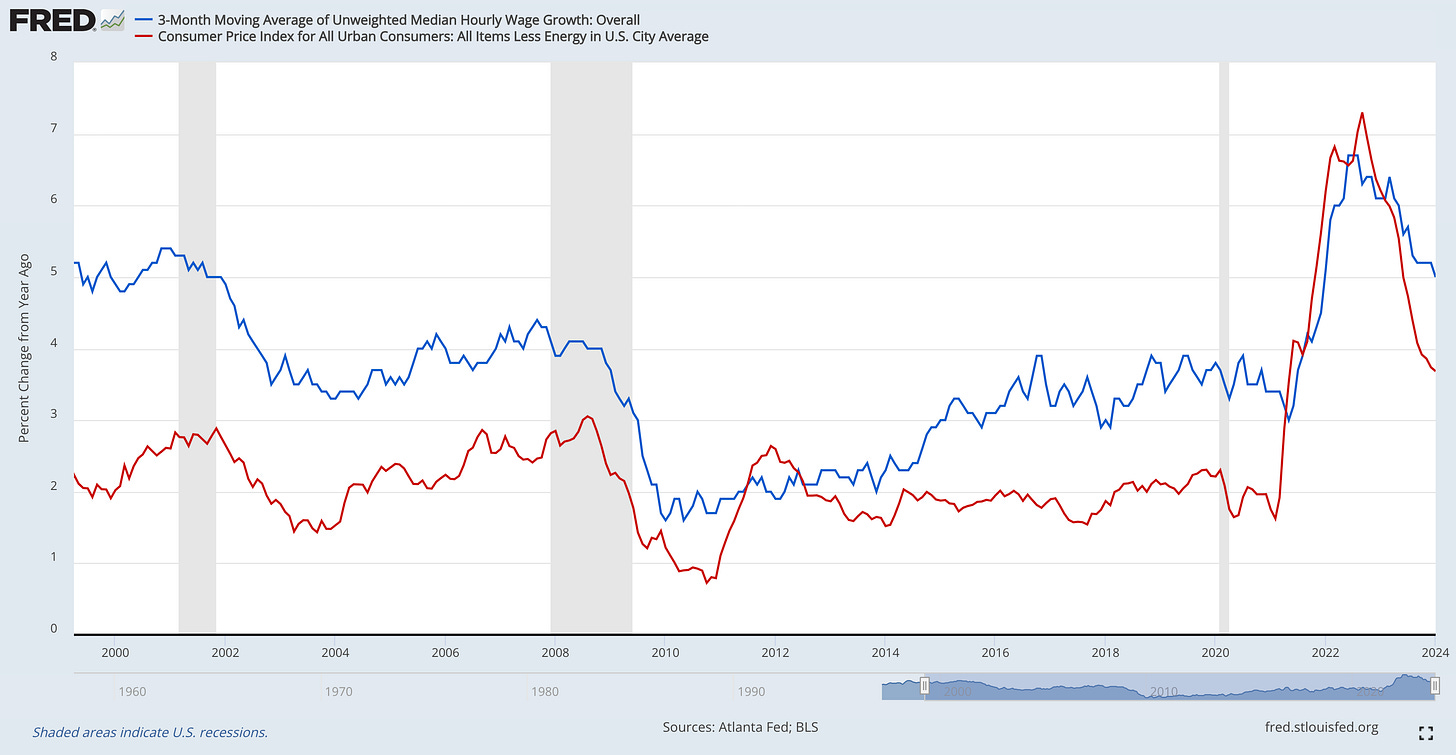
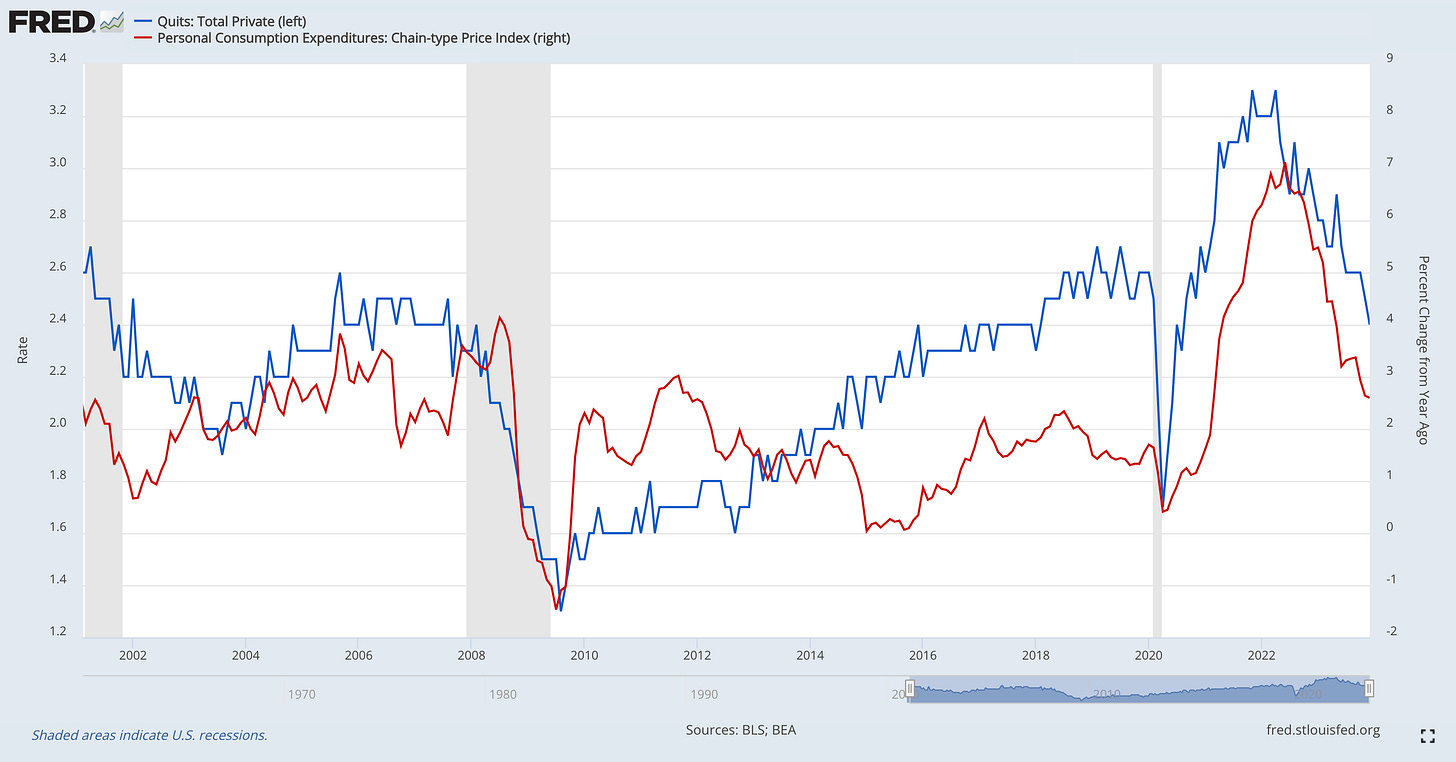
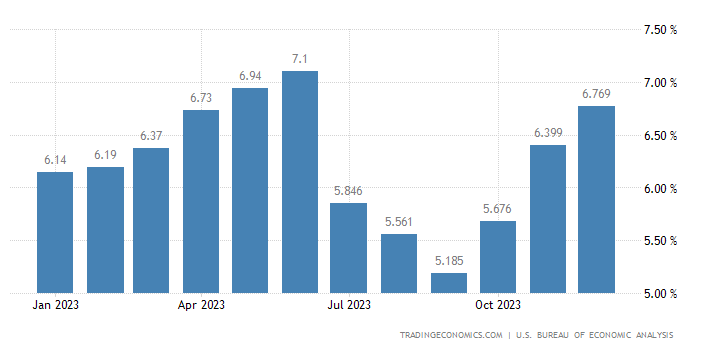
As we think about forecasting where inflation is likely to go in the future, using proven correlations will be extremely useful. We’ll address a variety of different labor market datapoints and various inflation datapoints. (Please see the appendix for full charts)
Atlanta Fed Wage Growth Tracker vs. Headline CPI ex-Energy YoY (Jan.’24):
Quits Rate vs. Personal Consumption Expenditures (PCE) YoY (Dec.’23):
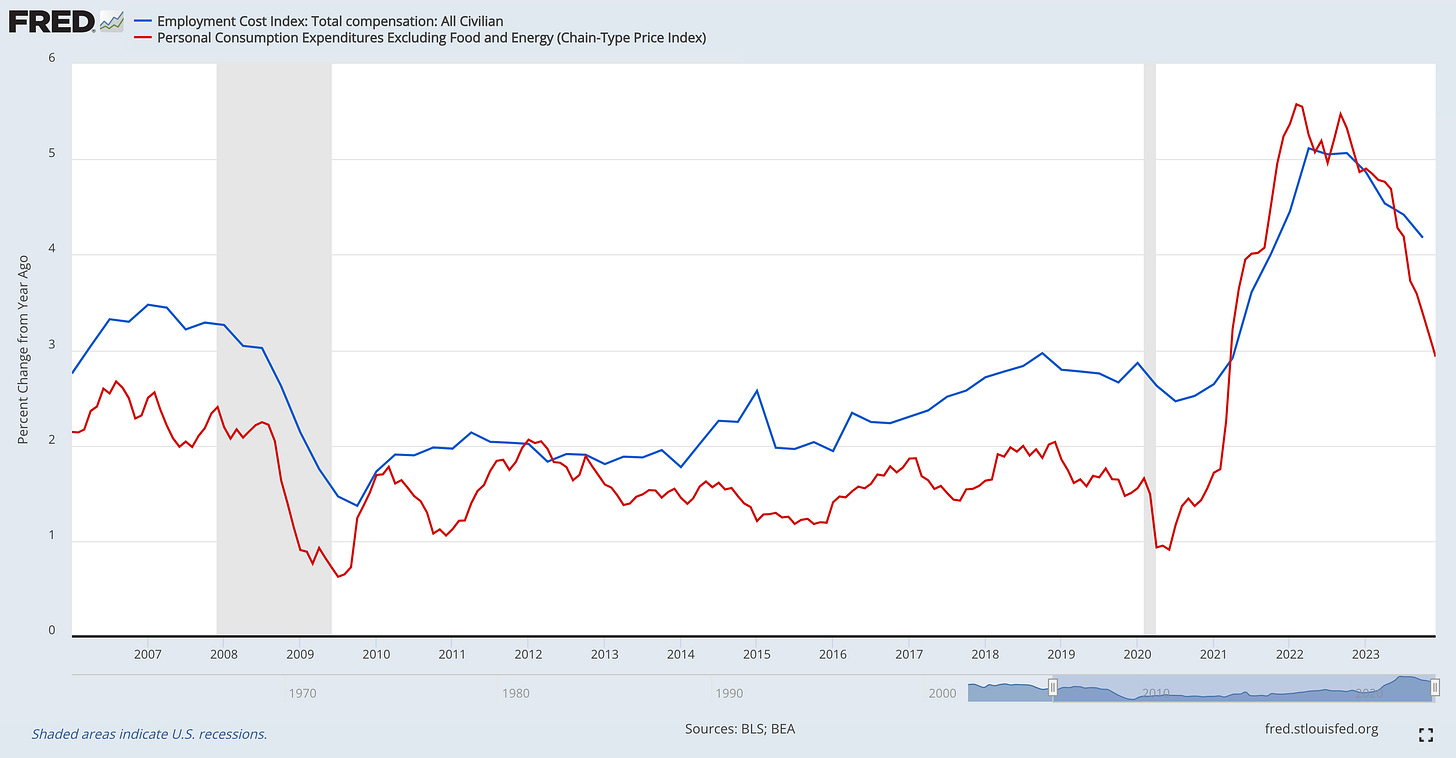
Employment Cost Index vs. Core PCE YoY (Q4’23 & Dec.’23, respectively):
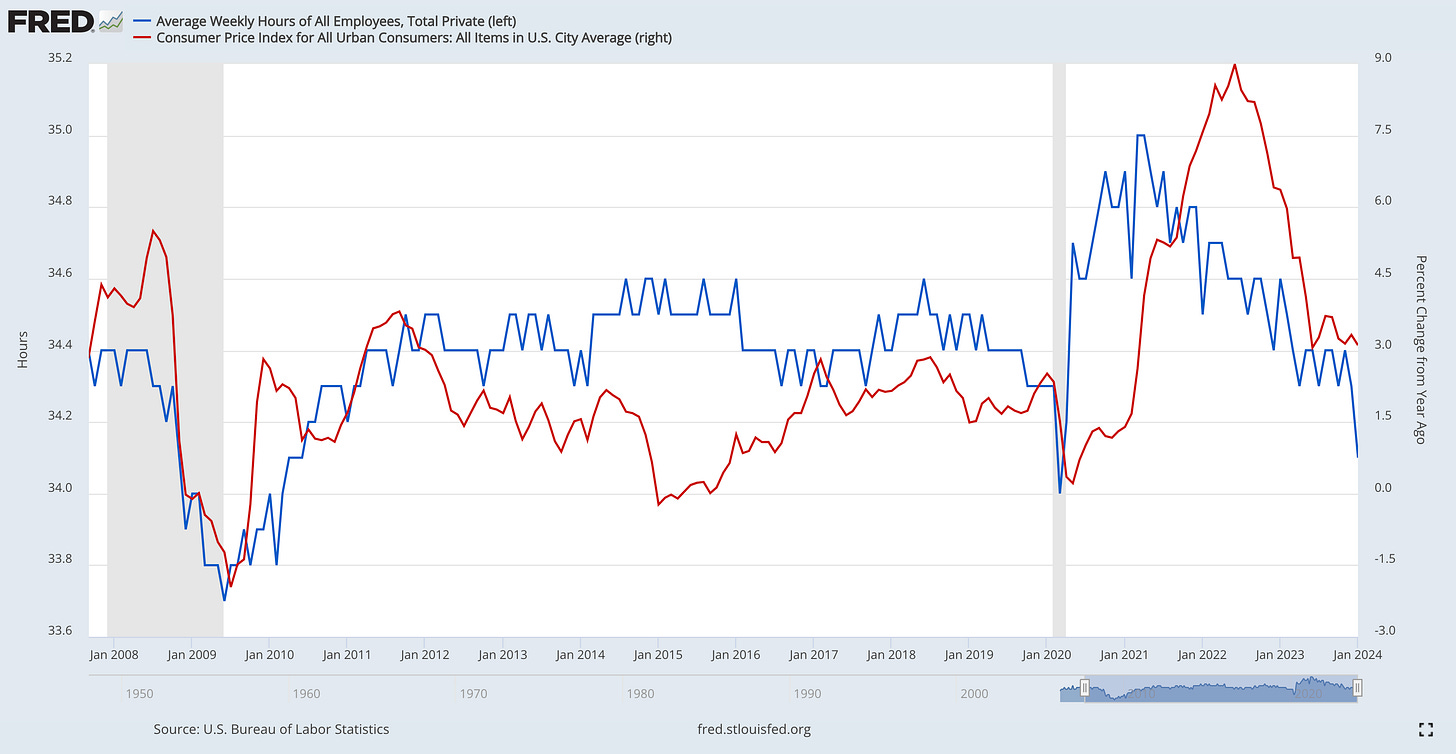
Average Weekly Hours Worked vs. Headline CPI YoY (Jan.’24):
On the aggregate, labor market data reflect slower wage growth, lower costs associated with employment, and less hours worked. At the very least, these dynamics won’t be the catalyst for a re-acceleration of inflation.
Diffusion index and supply chain notes
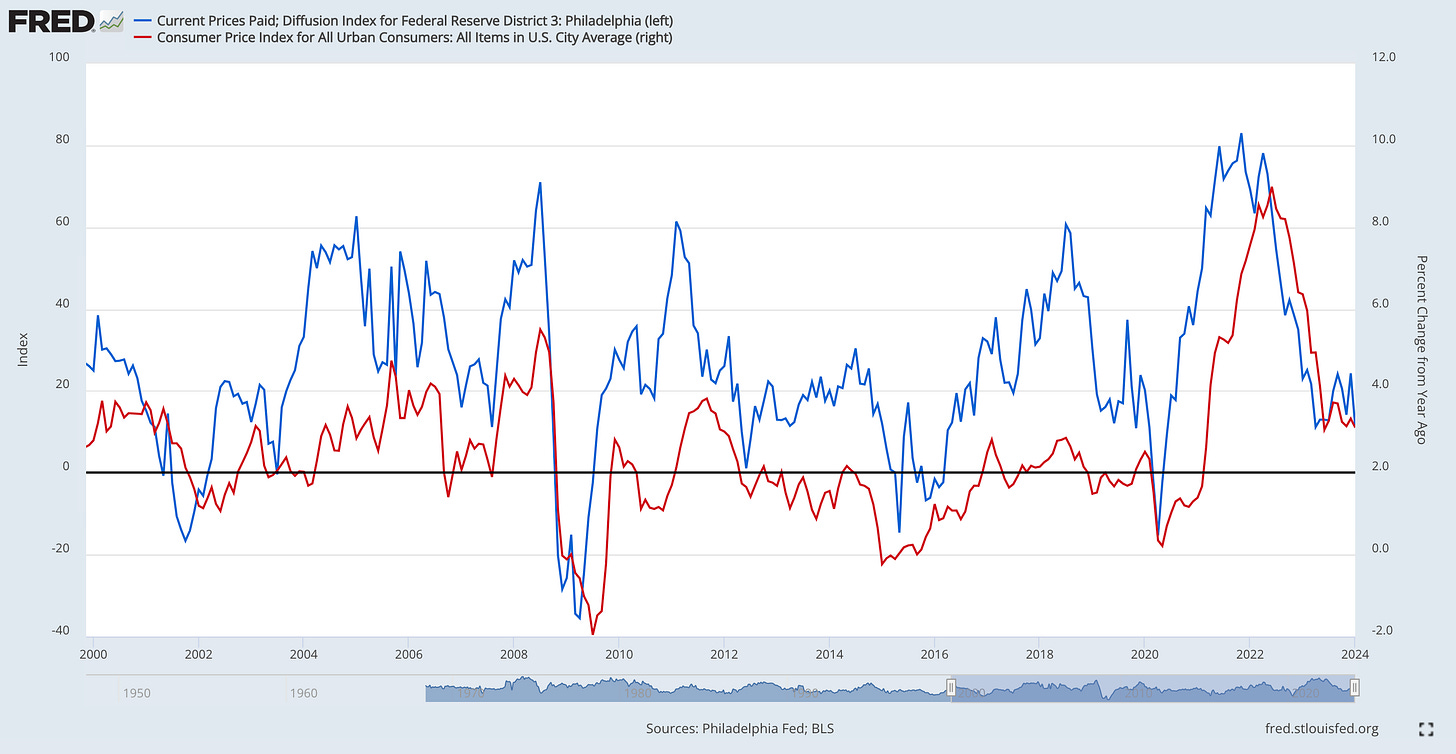
Moving past labor market dynamics, the Prices Paid Diffusion Index for the Philadelphia district has a clear correlation with headline CPI on a YoY basis:
The latest print for the Diffusion Index showed a significant decline in current prices and is likely to produce a notable ripple effect for CPI inflation in the months ahead.
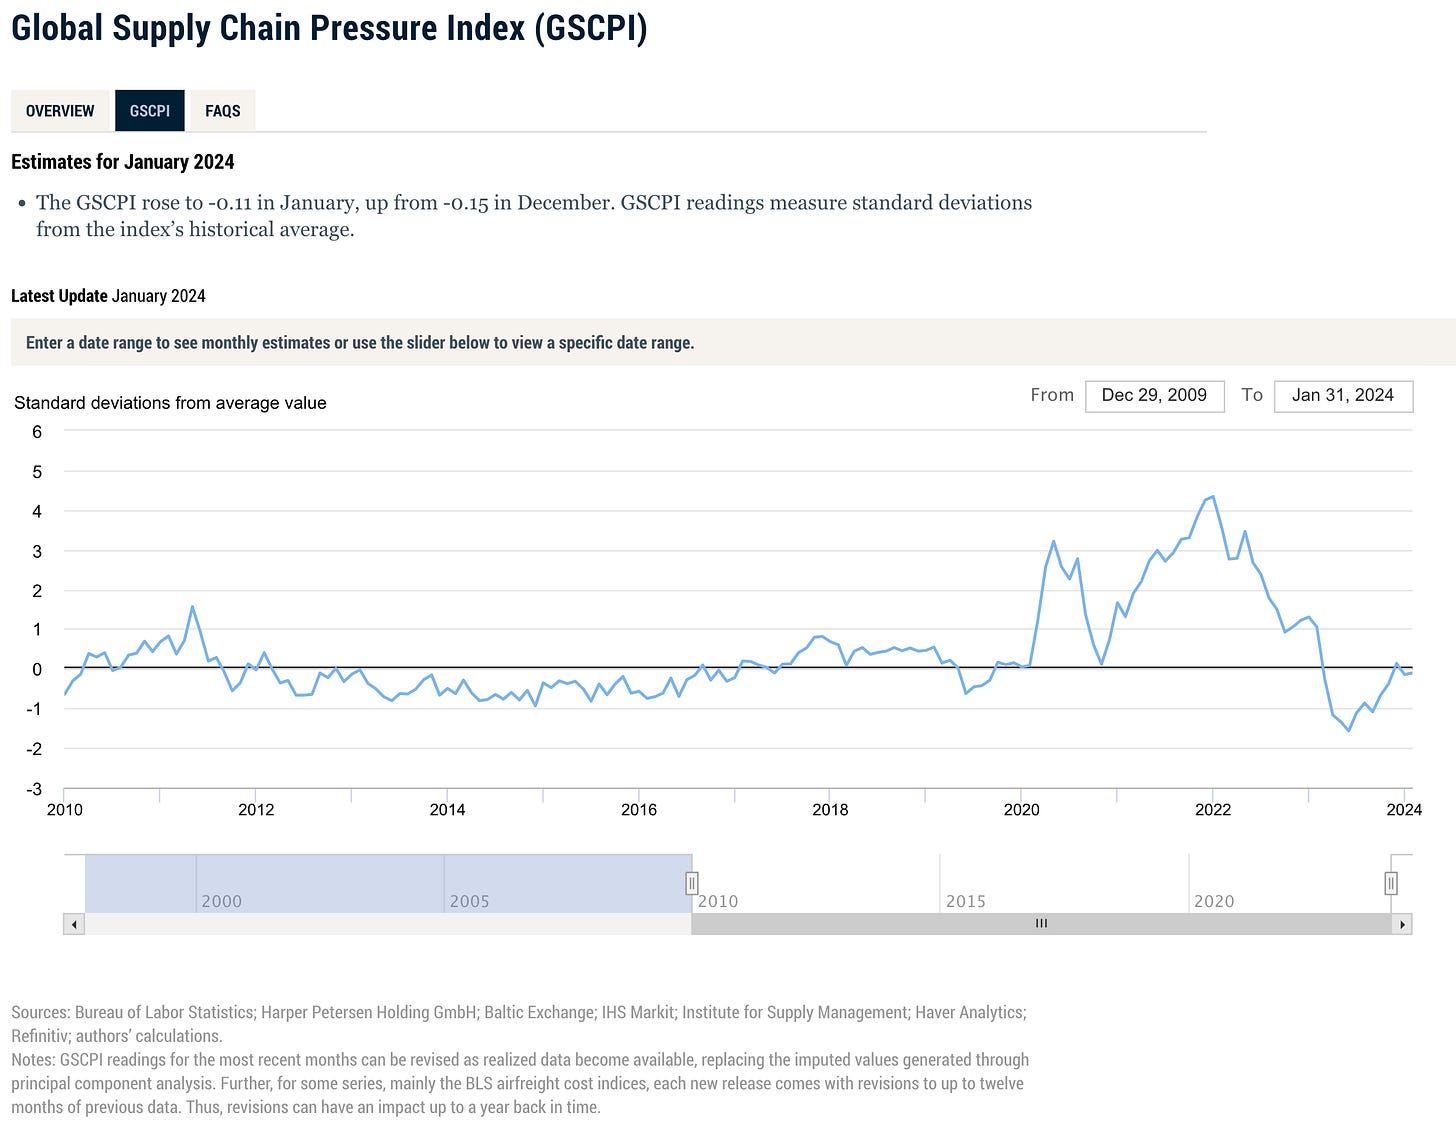
We can also reference global supply chain dynamics and their impact on inflation.
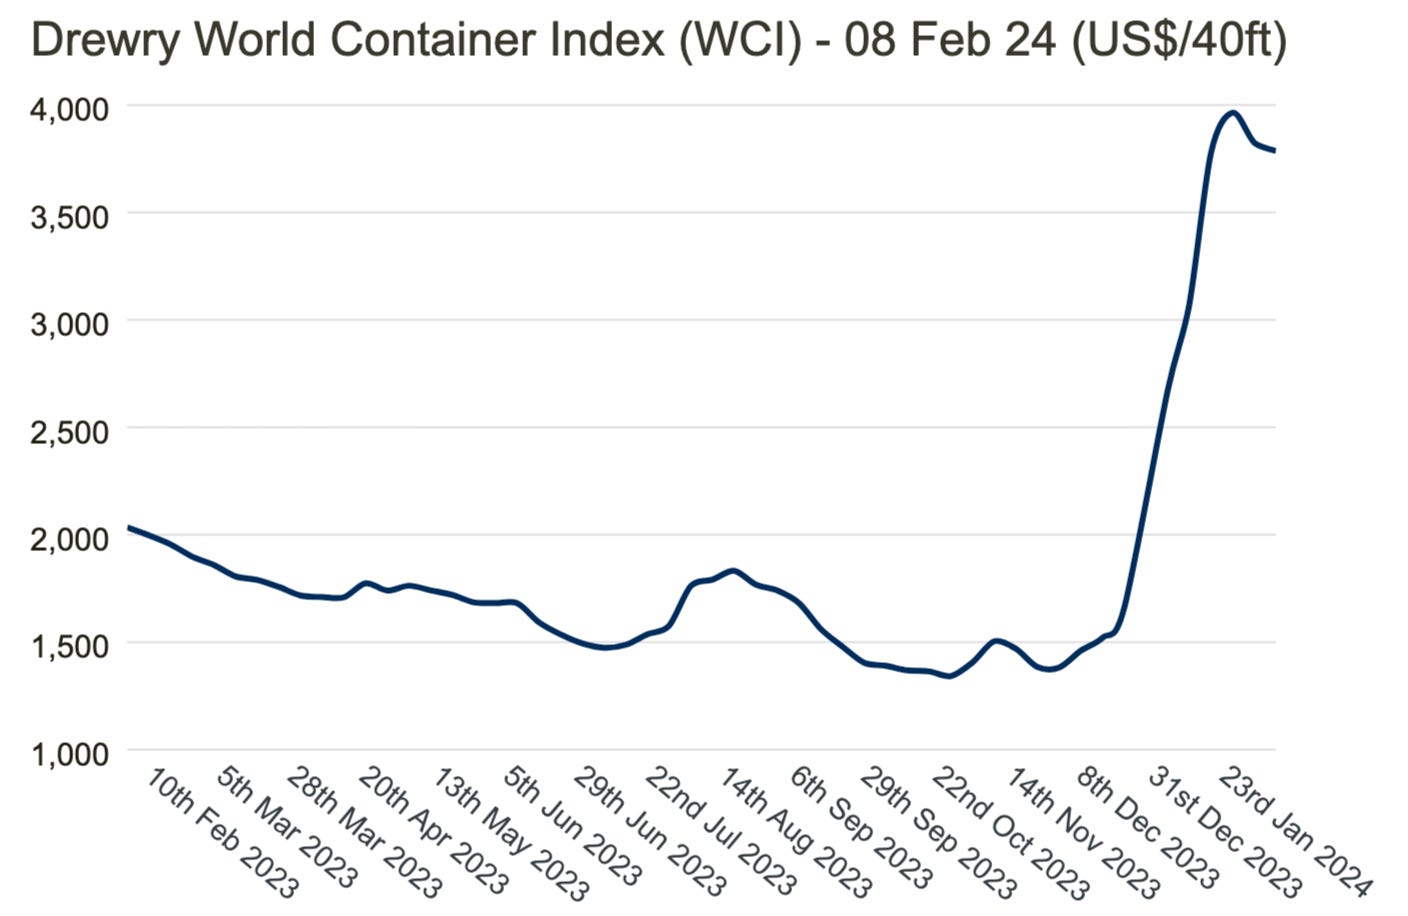
While the situation in the Middle East caused an increase in global shipping rates, the Drewry World Container Index is already starting to roll over & didn’t produce a meaningful acceleration of inflation.
Additionally, the Global Supply Chain Pressures Index remains below zero, implying a negative standard deviation (aka loose conditions) vs. historical supply chain conditions.
The relationship with money supply
Shifting to monetary & credit components, I’ll reference Milton Friedman’s famous quote.
“(Inflation) is always and everywhere, a monetary phenomenon. It's always and everywhere, a result of too much money, of a more rapid increase in the quantity of money than an output.”
Therefore, it’s important to recognize that:
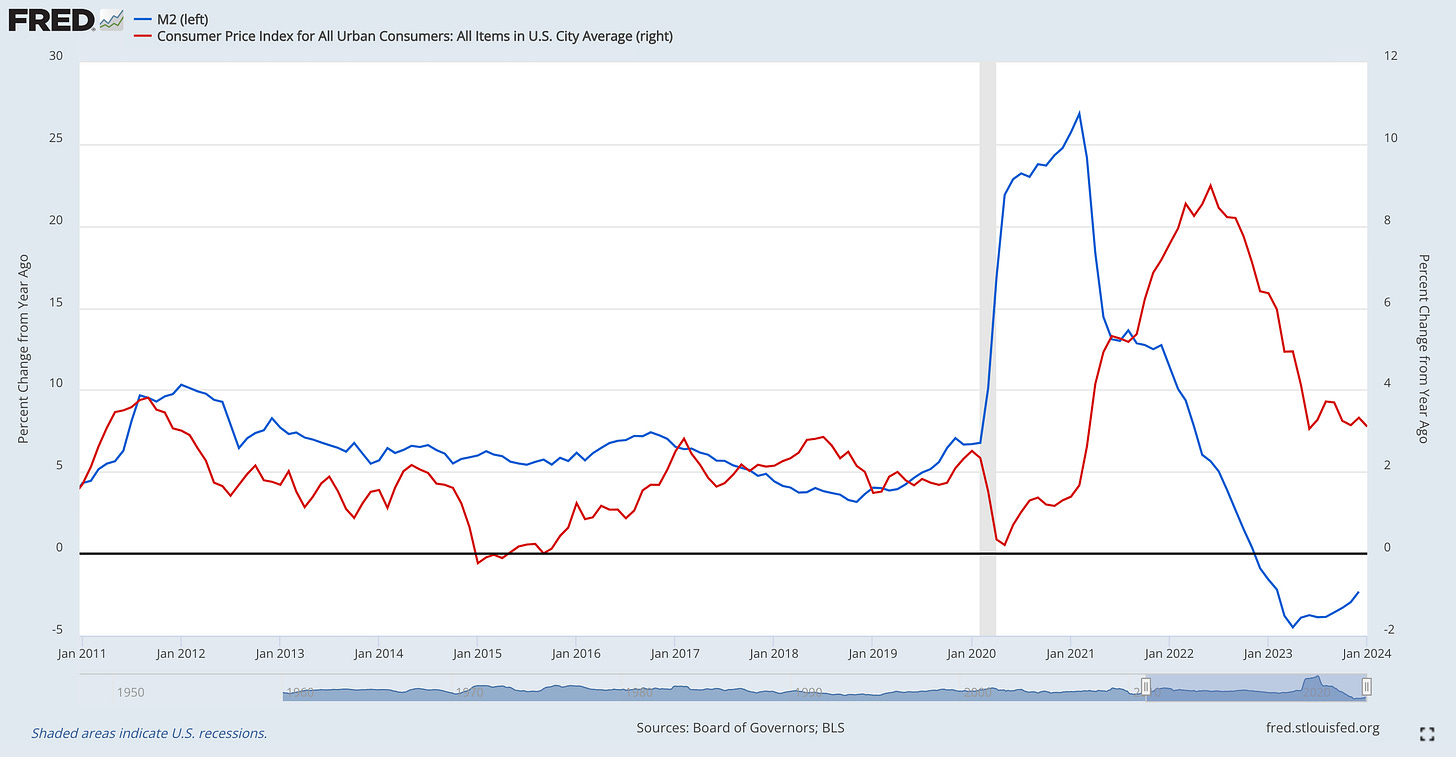
The rate of change in M2 has historically been a leading indicator of headline CPI
M2 has been contracting on a YoY basis since December 2022
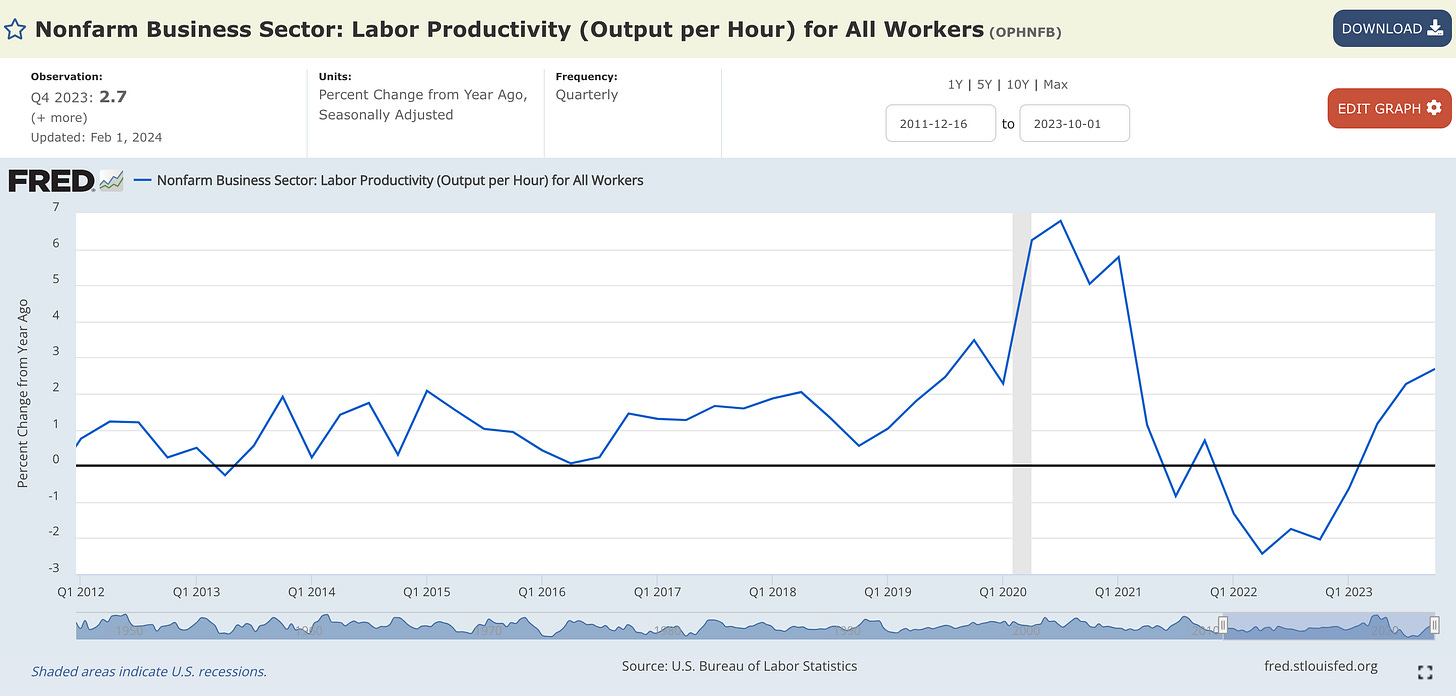
Given the ongoing contraction in money supply, disinflation is likely to persist, especially when we consider that output (the 2nd component of Friedman’s analysis) is continuing to rise and productivity is also rising!
If less money is chasing more goods/services, the price of goods/services will decline.
You might even notice that the contraction in productivity bottomed in Q2 2022, exactly when YoY inflation peaked! With the ongoing acceleration in productivity growth, the implication is that the cost-effectiveness of producing goods & services is improving and will allow price pressures to abate. That means disinflation.
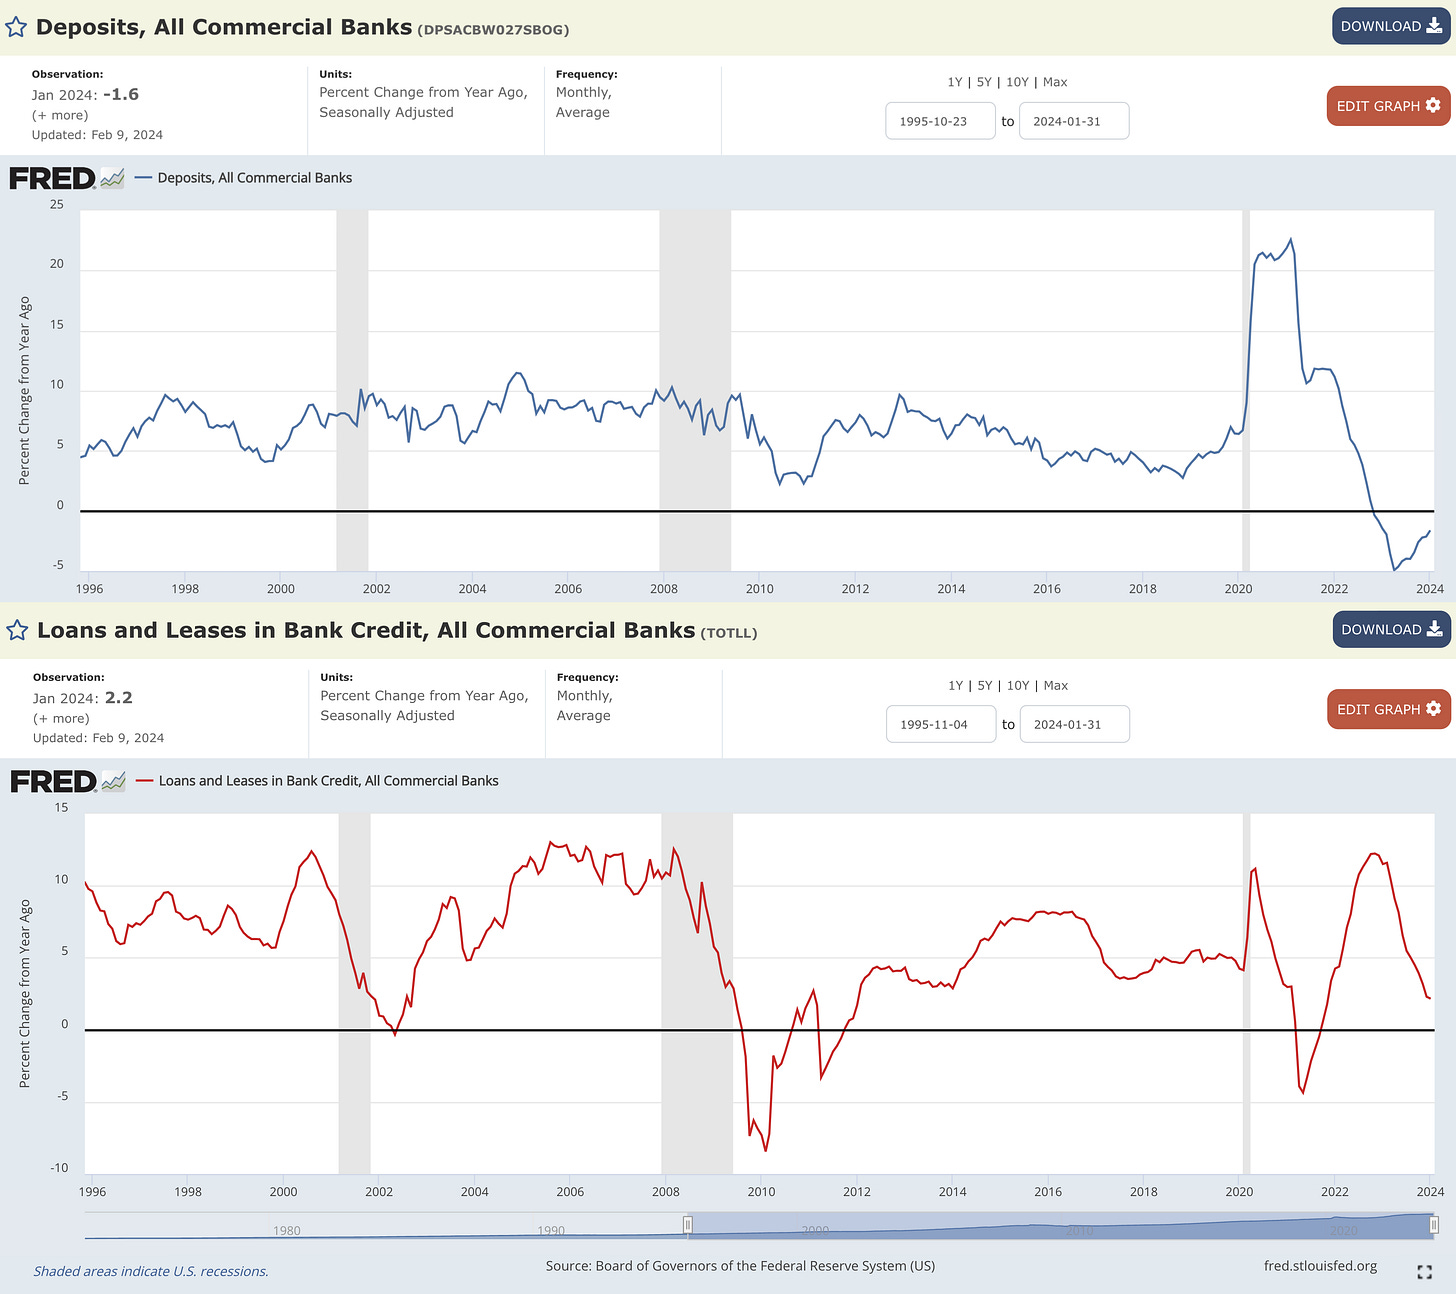
On top of the contraction in M2, U.S. commercial bank deposits and loans & leases are either contracting or decelerating:
Both variables confirm the M2 analysis & indicate that more disinflation is coming.
That’s a wrap from me.
AlphaPicks: Reflation
Our view on inflation moving back higher in the US is based on 4 key thoughts.
Firstly, let’s talk about GDP growth.
Growth isn’t slowing, so neither will inflation
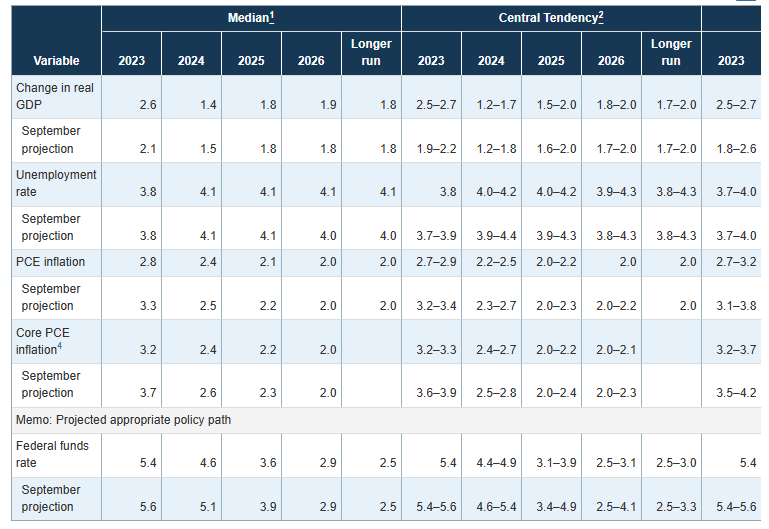
The economic forecasts released by the Fed back in December showed that they were banking on real GDP falling in 2024 versus 2023 (1.4% vs 2.6%). As such, this projection would help to get inflation back down to the 2% target. Their preferred measure (Core PCE) was forecasted to drop down to 2.6% in 2024.
The correlation here is clear: slower growth in the economy could be coupled with higher unemployment, easing wage pressure and ultimately helping to pour cold water on inflation.
Unfortunately, we’re seeing the opposite happen. The latest data we got for Q4 2023 showed a bumper 3.3% gain, much higher than the 2% that was expected by the market.
Granted, this figure is going to be factored into 2023, not 2024. But it shows us that the US economy is doing much better than many were expecting. Yet, a consequence of this is that we struggle to see inflation falling if this growth continues. Rather, it’s going to cause reflation.
Supply chain problems
Next up, let’s discuss the global supply chain problems that Caleb has referenced above. These have reared their ugly heads again with problems in the Red Sea. Attacks from terrorist groups on commercial shippers are forcing an exodus on the shipping lane. Instead, they are being rerouted around the southern tip of Africa.
This is longer and, importantly, much more expensive to do. Jitendra Popat, the National Head of Sea Freight at Jeena & Company, commented that:
“A 40-foot container that used to cost $500 started costing $1,000 on December 20, $2,150 on January 1 and $3,600-4,400 from January 16,” he explains. “Freight rates increased 700% to 850% in a short span of 1.5 months.”
Stephanie Roth, Chief Economist at Wolfe Research, estimated that for every 40% increase in shipping rates, core inflation would rise by 0.1% in the US.
Of course, these shipping rates will need to remain elevated for several more months before a meaningful impact will be felt on costs in the US. However, the broader conflict in the Middle East shows little signs of abating anytime soon.
If this continues, we believe that companies will be forced to add on the extra price hikes to consumers, stoking the inflation pot.
Look at the core figures
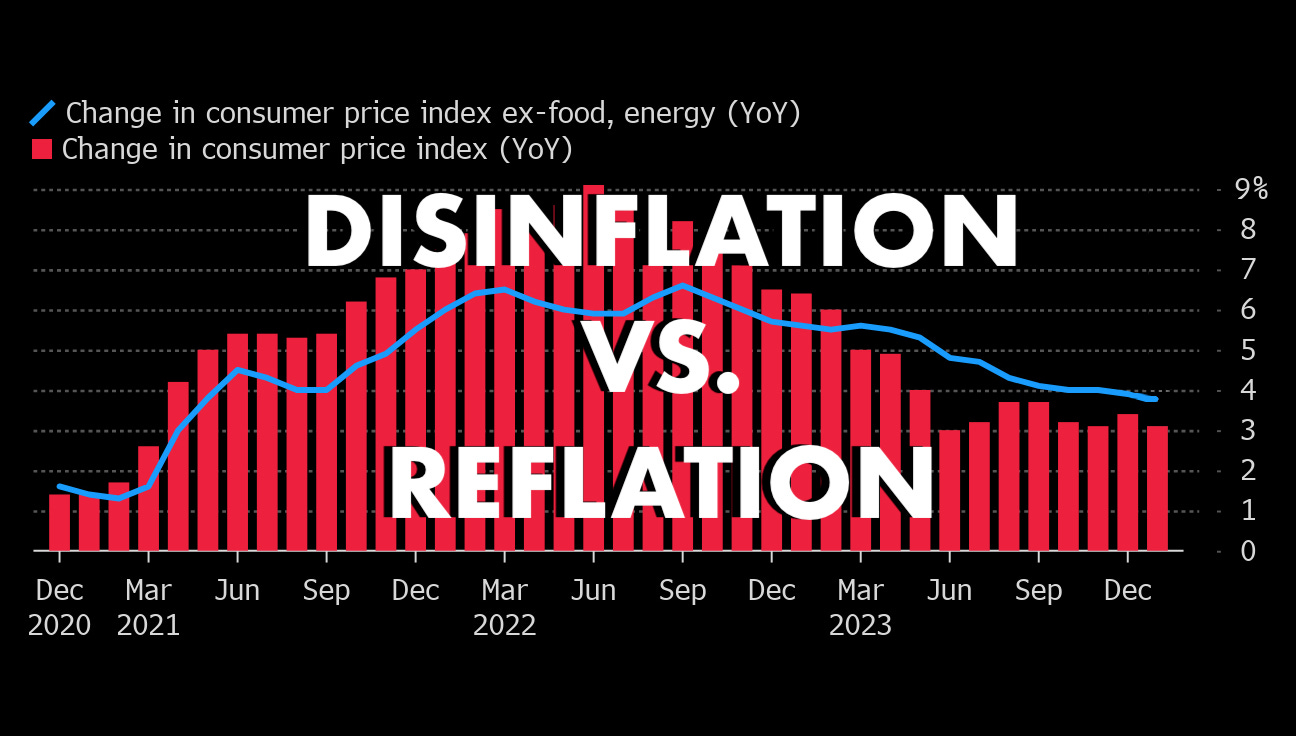
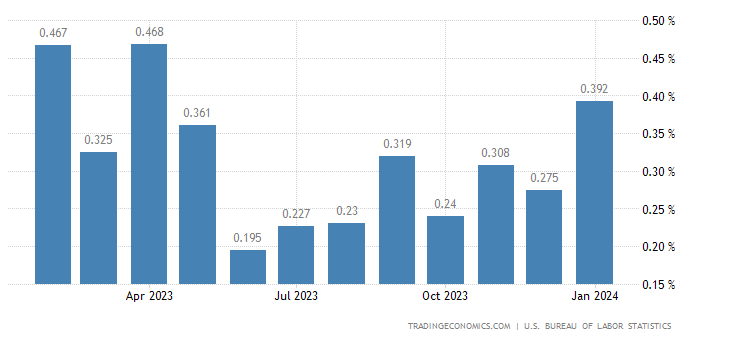
When we strip out food and energy, the change in CPI hasn’t been heading lower since last summer, but rather higher. This is shown below:
Given the fact that core inflation excludes volatile components such as food and energy prices, it offers a more stable measure that reflects underlying trends in the economy. While the headline inflation number provides a comprehensive view of overall price changes, it can be subject to short-term distortions (e.g. from energy prices).
So, if the core figure provides us with a more accurate finger-on-the-pulse reading for the US, the rise in it surely tells us a story that we can’t ignore.
Resilient labour market
Another data set that really caught the market by surprise was the bumper NFP print from earlier this month.
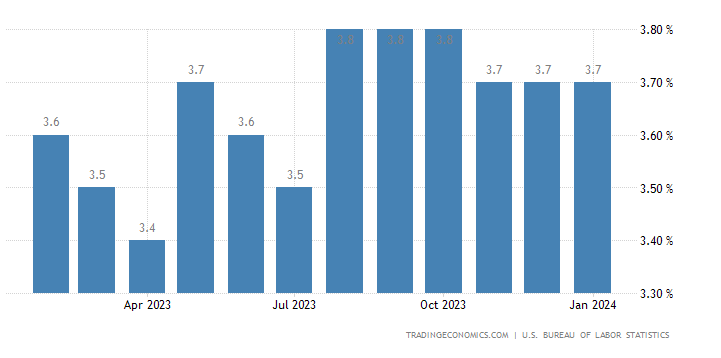
The reading of 353,000 jobs added for January blew the expectations of 155,000 out of the water. Add into the mix the stubbornly low unemployment rate (shown over the past year below), and we have several signs that show little softening in the labour market.
Ideally, the Fed want a softer labour market, which should ease wage growth and stop this element from increasing the inflation figure. Yet wage growth isn’t falling and won’t fall unless we see employers hiring less / cutting more, or limiting earnings upside.
Wage growth YoY % change is shown below:
Bringing it all together
With an economy that is providing strong GDP growth, a labour market that is hot and supply chain price pressures threatening to boil over, we think inflation will head higher in the coming months. The core figure is already rising, which will limit any potential fall in the overall CPI figure.
We don’t want to attach an arbitrary forecast figure to inflation for the US this year, but we think it’ll be well above the 2.6% that the Fed forecasted in December.
Appendix
M2
Labour Productivity
Drewry World Container Index


