

Global Primer Series: Credit Default Swaps
The derivative at the heart of modern credit risk transfer.

For all the focus on bond yields, equity volatility, and economic growth, the market’s clearest view on credit risk trades in a more specialised arena: the CDS market.
Short for Credit Default Swaps, CDS are derivative contracts that function like insurance on corporate or sovereign debt. They allow investors to hedge against default, speculate on credit deterioration, or construct relative value trades across the capital structure. In many cases, they serve as the most liquid expression of credit risk—more responsive than cash bonds, and more versatile than credit ETFs.
CDS markets are used by banks, hedge funds, insurance companies, asset managers, and macro desks. They play a critical role in price discovery, risk transfer, and credit portfolio construction. And during stress events, they often move before anything else does.
This primer walks through:
- CDS basics (mechanics, pricing)
- The role of CDS in hedging and trading
- Credit curves, capital structure arbitrage, and basis trades
- Key participants and use cases
- Notable dislocations and blowups
- Why CDS matters for market structure and liquidity
If you like FX basis, STIRs, or convexity in obscure derivatives, you’ll enjoy this one. If you don’t, well, this is how the big players hedge credit risk. It’s worth understanding.

Understanding a CDS
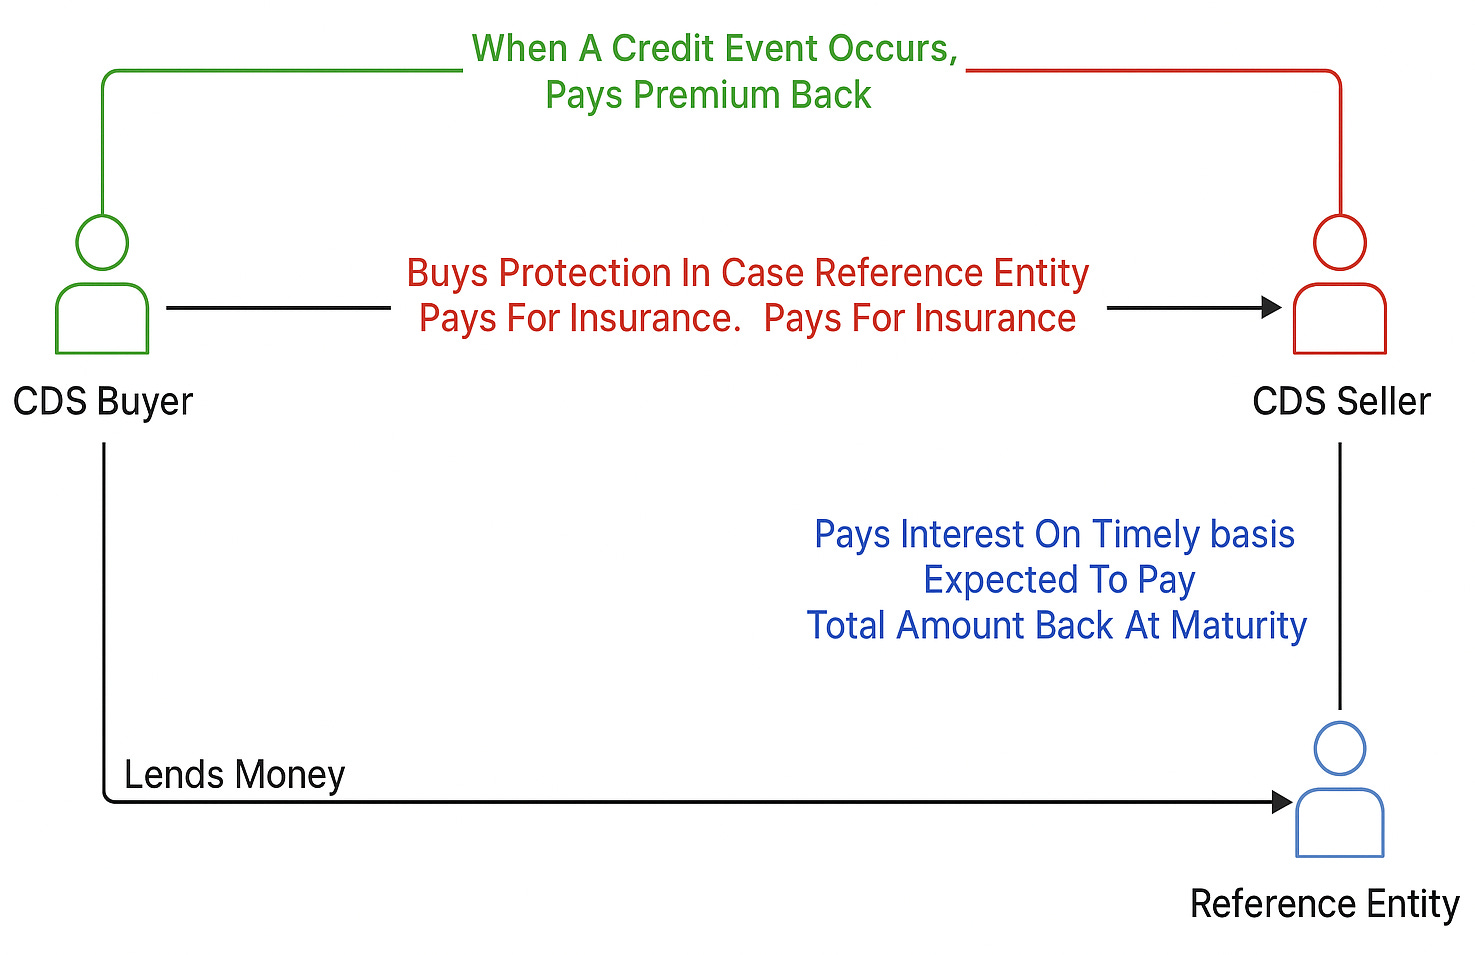
At its core, a Credit Default Swap (CDS) is a bilateral derivative contract designed to transfer credit risk. One party (the protection buyer) pays a periodic premium to another party (the protection seller) in exchange for compensation if a predefined credit event occurs1.
The CDS is settled against a reference entity (a corporation or sovereign) and applies to a reference obligation, usually a specific bond issued by that entity. If the entity defaults, the protection seller compensates the buyer by delivering the defaulted bond (physical settlement) or paying the loss value (cash settlement).
CDS contracts are usually quoted in basis points (bps) per annum on the notional amount of protection. The wider the spread, the higher the reference entity’s perceived credit risk.
For example, let’s take an investment-grade rated corporation, JP Morgan. The chart (in bps) of a five-year CDS is below. The five-year maturity is widely considered the benchmark for pricing and liquidity in general in the CDS market.
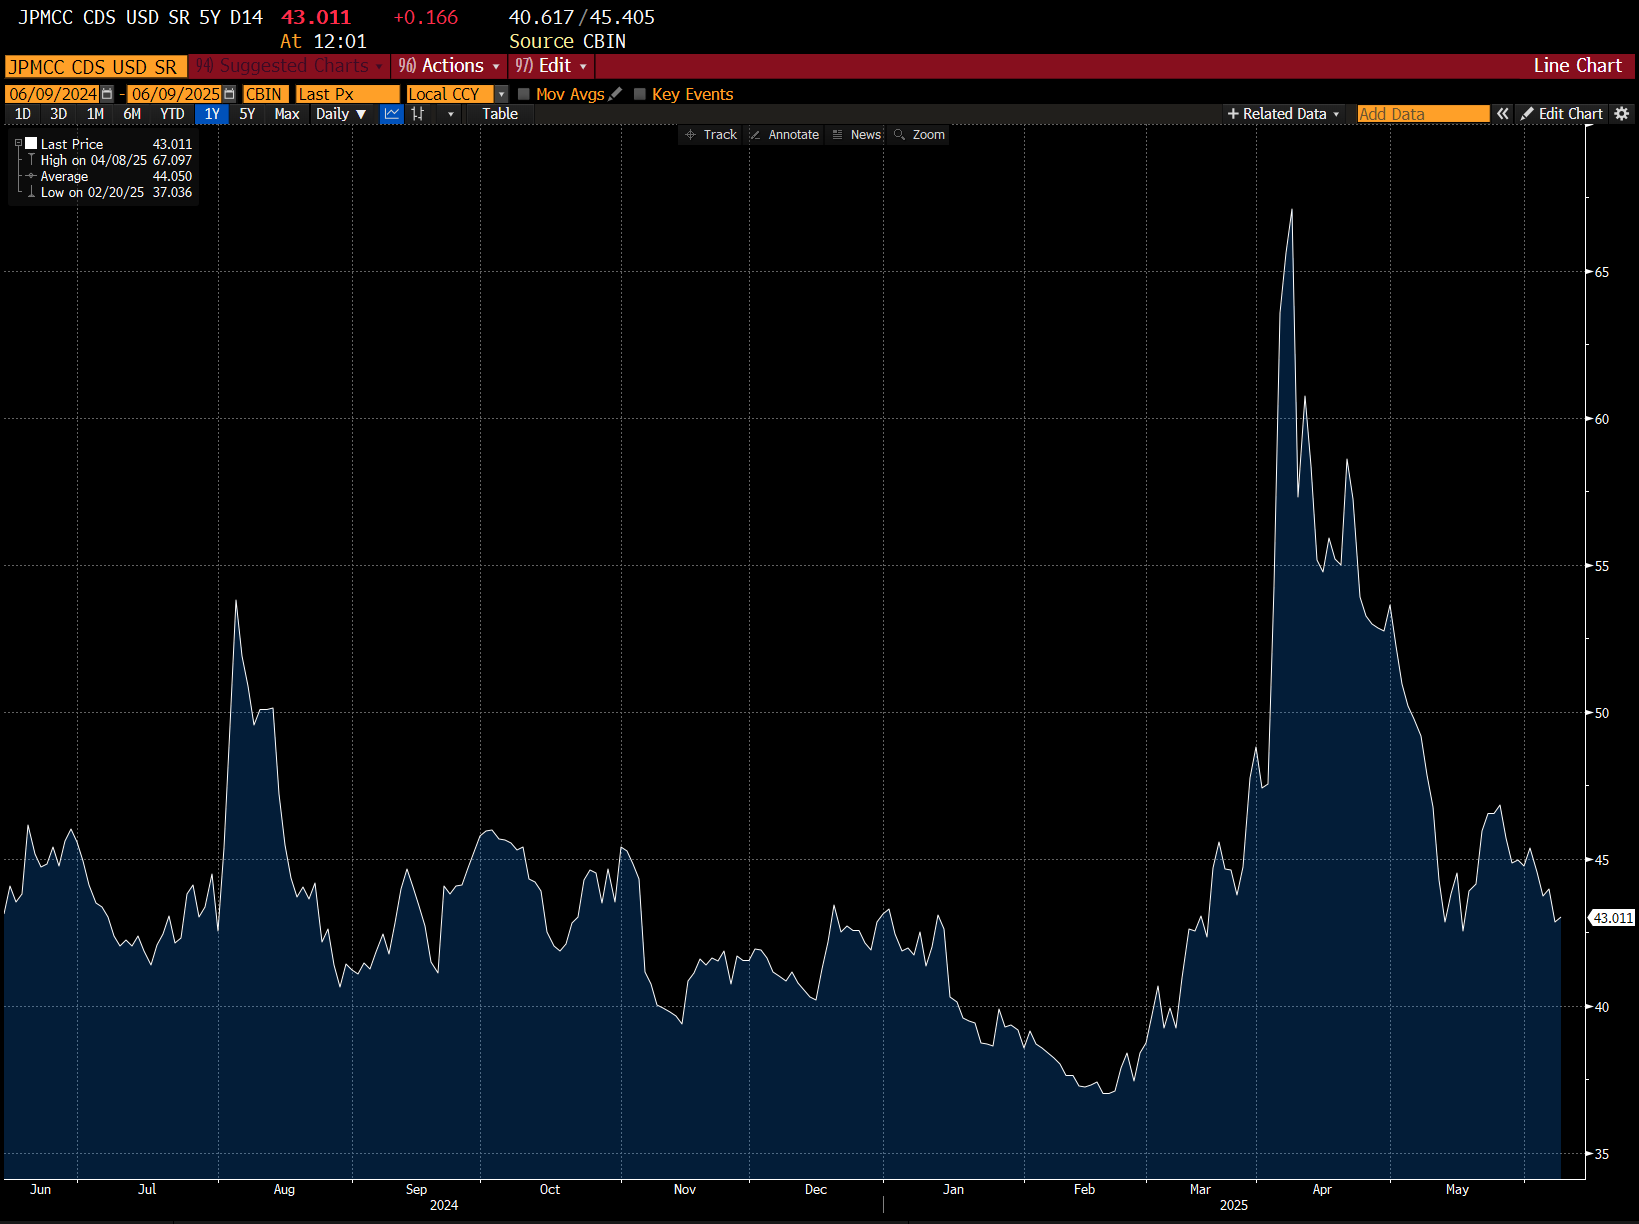
The five-year is trading just above 43bps. This means that for every $1m notional bought, a 0.43% premium is paid annually. In reality, this premium accrues and is typically paid quarterly.
If JPM defaults within this period and the bond recovers at 40 cents on the dollar, the CDS pays out $600k (i.e., $1m × (1 – 0.40)).
JPM has a relatively low CDS spread, with the payoff versus annual premiums being considerably different. However, consider the historical five-year period for Carnival Cruises. In the aftermath of the pandemic, there was serious concern that the lockdowns and lack of travel could put the operator out of business.
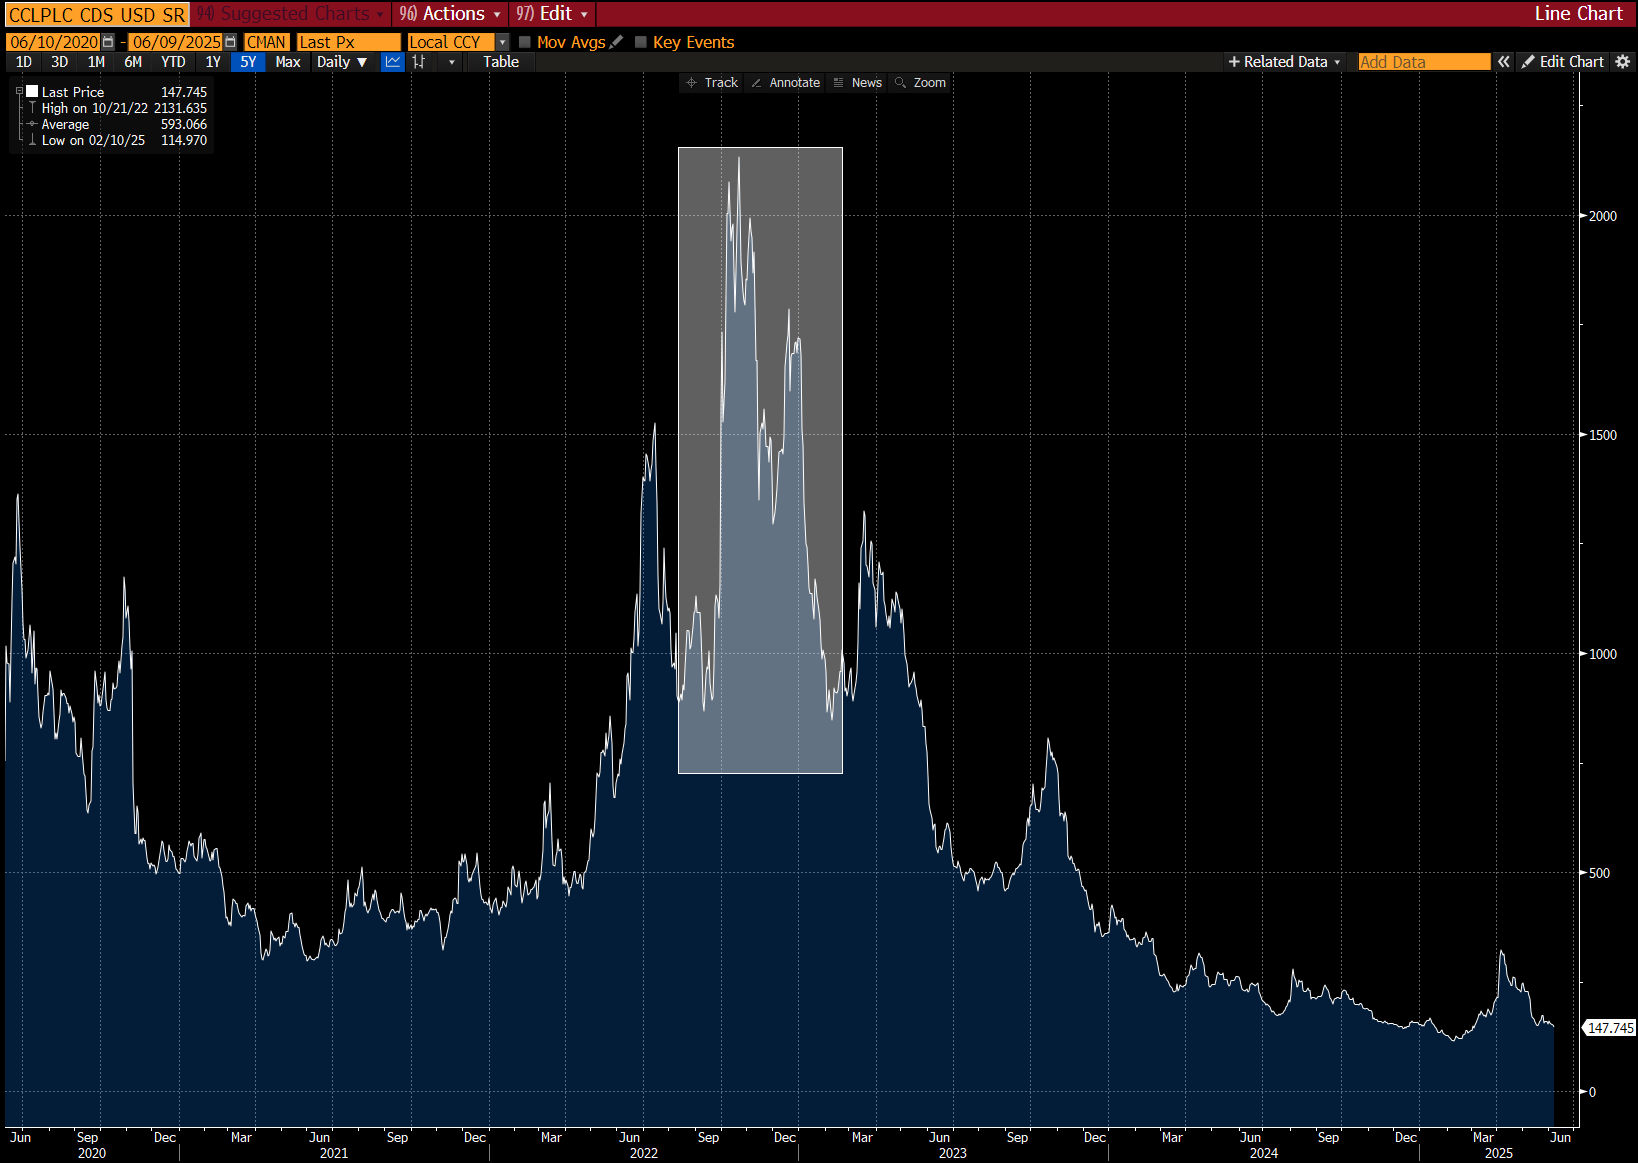
In late 2022, the spread spiked above 20%, implying that the annual premium equated to one-fifth of the notional payout in the event of default. This sharp widening reflected heightened market concern around credit risk.
The five-year CDS is also a useful tool for comparing company creditworthiness. Although Carnival is currently operating under normal conditions, its spread remains elevated at 147bps, nearly four times that of JPM.
One might consider shorting the firm’s bonds to express a similar bearish credit view. While this approach can work in certain contexts, it’s important to contrast the two instruments to understand the differences in exposure, liquidity, and execution.
CDS vs. Bonds
CDS offers a purer and often more liquid expression of credit risk than the cash bond market. It isolates the default component, stripping out interest rate duration, repo financing, and coupon variability.
Because CDS contracts are standardised and trade over-the-counter (with central clearing increasingly common), they are more flexible instruments for hedging, especially when it comes to building or managing credit exposure across a portfolio.
Another key difference is speed. CDS spreads often move more rapidly than bond prices. In periods of market stress, traders tend to reach for CDS as the first instrument to price in credit risk, driven not only by liquidity but also by the efficiency and clarity of expressing directional views.
While bonds represent long exposure to credit (providing repayment unless the issuer defaults), CDS flip the structure. Buying CDS constitutes a short credit risk position, with the buyer profiting if the reference entity deteriorates or defaults. Conversely, selling CDS creates long credit risk exposure, in which the seller receives premium income in exchange for assuming the risk of a credit event.
This asymmetric payoff structure makes CDS a critical tool for hedging long bond positions, constructing macro strategies around credit cycles, or isolating idiosyncratic credit risk at the single-name level.

Pricing, Premiums, and Payouts
At its core, a CDS contract is an insurance agreement. The buyer of protection pays a regular premium; the seller receives that income in exchange for assuming default risk.
There are two main legs to a CDS trade:
- Premium Leg: The protection buyer pays a regular premium (quarterly, in most cases) for the life of the contract or until a credit event occurs.
- Protection Leg: If a credit event occurs, the seller compensates the buyer, typically by paying the difference between par and the post-default recovery value of the reference bond.
CDS Spreads and Premiums:
As mentioned above with JPM, on a $1m notional, that’s circa $4,300 per year or $1,075 per quarter. If no credit event occurs during the contract’s life, the seller keeps the premium, and the contract expires.
But unlike fixed-rate bond coupons, CDS premiums aren’t baked into the upfront price. The contract is marked to market daily, and values fluctuate based on spread movements, just like a bond or interest rate swap.
CDS spreads are also widely used in credit risk modelling, counterparty valuation adjustment (CVA), and pricing of structured credit products. The implied probability of default embedded in the spread provides a key input across trading, risk, and capital modelling functions.
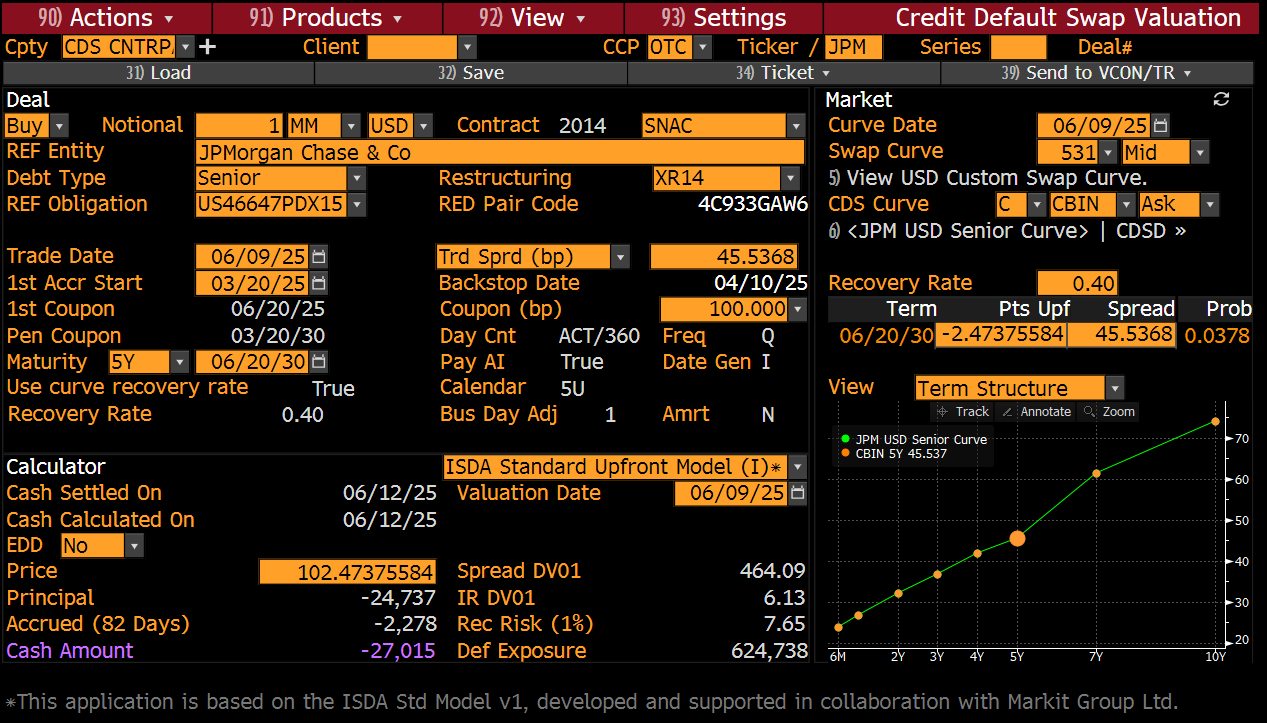
To best explain the following points, we’re going to base it on the deal screen for the JPM CDS.
Upfront Payments and Credit Curves:
For investment-grade CDS (where spreads are relatively low), contracts typically trade close to par. This means the upfront payment is pretty minimal; the spread itself represents the market’s view of credit risk. In the case of JPM, the price is trading above par at 102.47. This means the CDS has positive value to the seller.
For high-yield or distressed names, spreads can be hundreds or even thousands of basis points. In these cases, the CDS may require a much larger upfront payment at inception to account for the fact that the contractual coupon (usually fixed at 100bps or 500bps, depending on the market convention) is lower than the actual market-implied risk.
In the deal screen, the standard coupon is shown as 100bps.
To clarify, the premium leg is fixed, but the upfront cost adjusts the trade to fair value based on prevailing market spreads.
Credit curves are typically upward sloping—that is, longer-dated CDS contracts tend to trade at wider spreads. As illustrated in the bottom-right chart, the JPM curve adheres to this convention. However, as with yield curves, credit curves can invert under stress, particularly when short-term default risk rises sharply.
An inverted credit curve can also signal dislocation in near-term funding conditions or elevated concern over default within a specific time horizon—insights not always captured in cash bond curves.
The deal screen also displays a purple cash amount of $27,000. This figure reflects the combination of the principal difference (current price - par value x notional) and accrued premium. Together, these components determine the total upfront cash payment.
The Credit Event and Settlement Process:
If the reference entity defaults, the CDS pays out. But not all “bad news” triggers a credit event. The rules are strict, codified by ISDA (International Swaps and Derivatives Association), and standardised across contracts.
There are three main credit event types:
- Bankruptcy
- Failure to Pay
- Restructuring
Once a credit event is confirmed, the CDS is settled in one of two ways:
- Physical Settlement: The protection buyer delivers an eligible bond (or loan) and receives par from the seller.
- Cash Settlement: More common in recent years. The CDS is settled based on the recovery rate, determined through an auction process overseen by ISDA.
The ISDA auction process has become the standard settlement method across most CDS markets. It establishes a transparent and consistent recovery rate, ensuring both buyers and sellers can exit with defined outcomes.
Recovery Rates and Payouts:
In the case of a credit event, the payout to the protection buyer equals the difference between the notional and the recovery value of the reference obligation.
Payout = Notional × (1 − Recovery Rate)
If a $1m CDS triggers and the recovery rate is 40%, the protection seller pays the buyer $600k.
Recovery assumptions are a key input into CDS pricing models. For IG names, recovery is often assumed around 40%, while HY names might price with a lower implied recovery (20–30%), depending on market conditions and debt seniority. This impacts the default exposure.
Default Exposure = (1- Recovery Rate) x Notional - Principal
The deal screen can toggle the recovery rate from the standard 0.40. Note that the higher the recovery rate, the lower the default exposure becomes:
0.4 RR
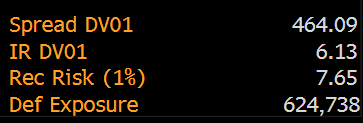
0.7 RR
This is logical and shows how the bond’s creditworthiness is factored in multiple ways when breaking down a CDS.
The market-implied CDS spread pricing is essentially the cost of insuring a bond against default, adjusted for the probability of default and expected recovery.
Mathematically: CDS Spread ≈ Probability of Default × (1 − Recovery Rate)
This identity holds at the core of CDS valuation and is a common shortcut used in the front office to estimate fair spread levels quickly. In reality, CDS pricing also reflects liquidity conditions, dealer positioning, and counterparty risk, but the spread-recovery-default triangle remains the bedrock.
Hedging and Trading with CDS
CDS contracts were designed initially as hedging tools. Over time, they evolved into active trading instruments used across credit markets, from directional views to structured arbitrage.
Hedging Credit Exposure:
The most straightforward application of CDS is to hedge bond holdings. Example: Consider a portfolio holding corporate bonds issued by JP Morgan. If the investor is comfortable with the interest rate exposure but concerned about potential spread widening or default risk, buying CDS protection on the bank offers a direct hedge. This approach avoids the need to sell the bonds (which may be illiquid, tax-inefficient, or operationally difficult to replace) while isolating and mitigating the credit risk component.
Doing so converts a credit-sensitive bond into something closer to a risk-free asset. The mark-to-market changes in the bond and the CDS should (in theory) offset each other as credit spreads move.
Look at how a drop in the price of the 2030 JPM bond saw a corresponding spike in the CDS:
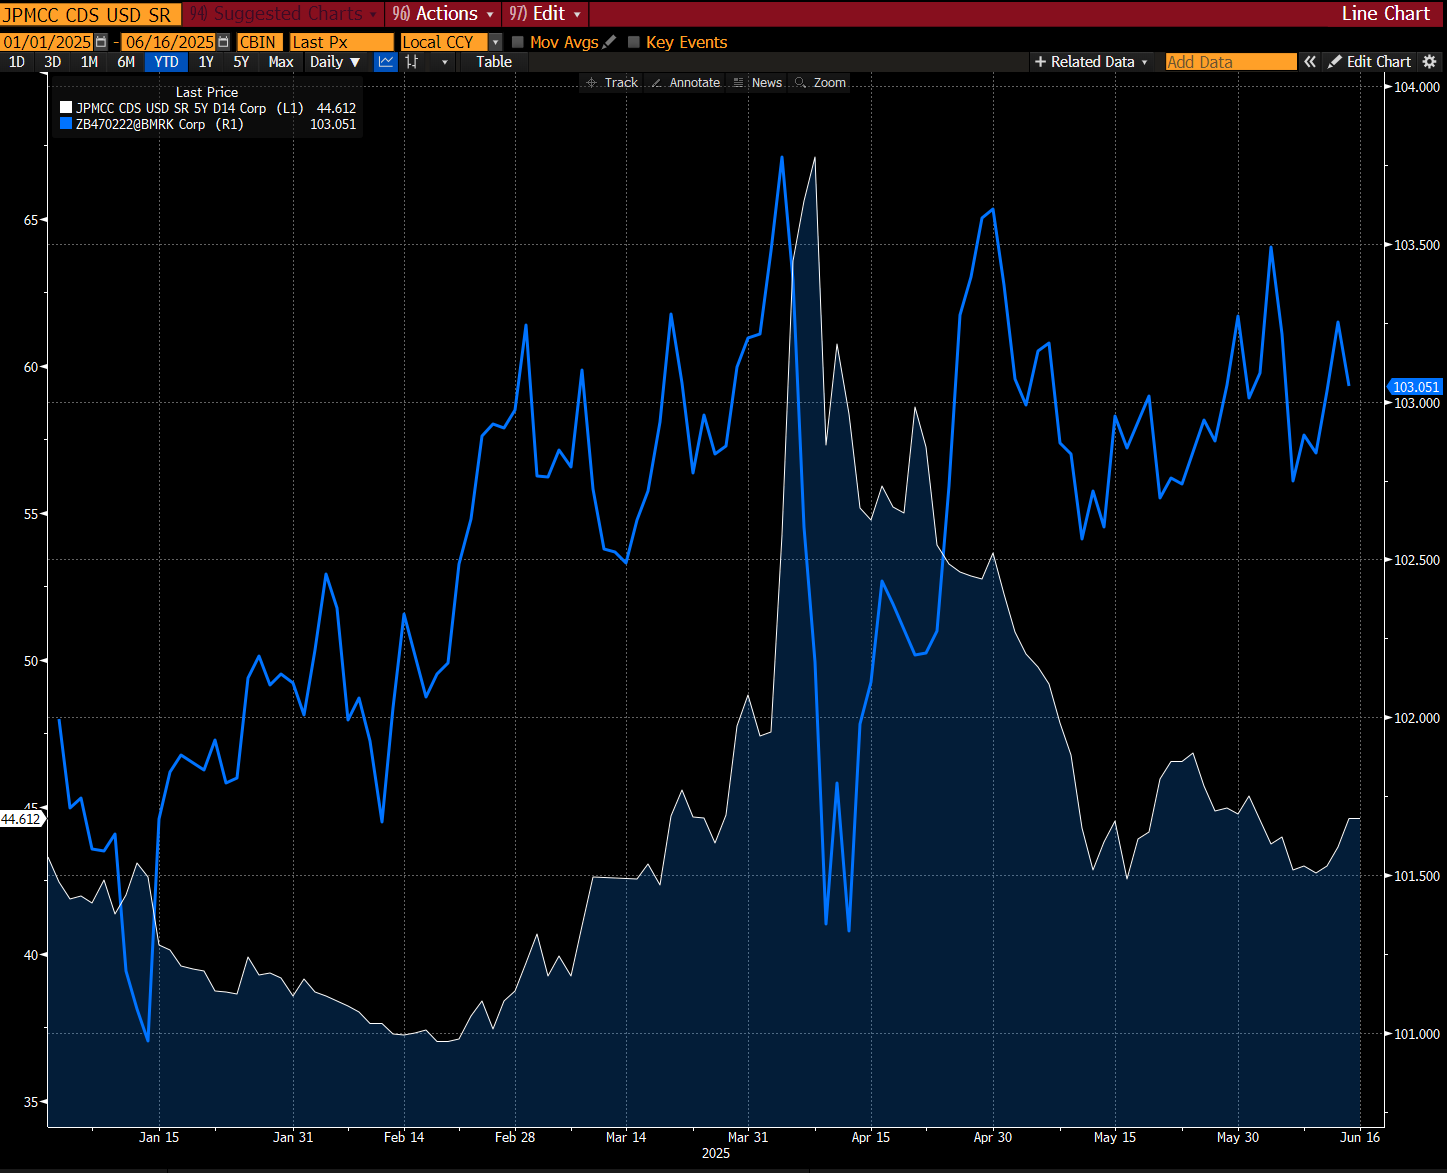
Hedging via CDS is common among asset managers, insurance firms, and banks, especially under capital frameworks like Basel III, where credit risk charges can be actively managed through CDS overlays.
Speculating on Credit Moves:
Just as CDS can hedge a long bond, they can also be used to take a view on credit deterioration or improvement:
- Bullish on credit: Sell CDS, collect premium, and hope no credit event occurs.
- Bearish on credit: Buy CDS, and profit if spreads widen or the reference entity defaults.
Because CDS spreads are quoted in basis points of annual premium, the mark-to-market sensitivity of a CDS position is straightforward. The P&L from spread moves is easy to calibrate for a given notional amount, making CDS an efficient instrument for short-term tactical trades or long-term macro themes.
Capital Structure Arbitrage:
CDS can also express relative value views across an issuer’s capital structure. One common strategy involves going long the equity of a company while simultaneously buying CDS protection on its debt. This setup allows a trader to isolate discrepancies between how equity and credit markets price the same underlying risk.
In theory, equity holders are junior to debt holders in the capital structure and should demand a higher return (and price in more risk). But in practice, markets often diverge, particularly in volatile or distressed environments. When credit spreads widen sharply while equity prices hold firm (or vice versa), it can signal mispricing between asset classes.
Example: Let’s say JP Morgan is going through a stress event, and a trader might feel the bond market has overreacted to default risk, while equity markets are pricing in a faster recovery. A trader might fade the panic-driven CDS widening with equity puts in those cases. If they’re correct, they’ll profit from tightening the spread, but give up some of the total gains from losses from the puts. In reality, it becomes a market-neutral trade that aims to target pricing inefficiencies across the capital stack (credit views relative to equity sentiment).
Basis Trades:
Another strategy in CDS markets is the basis trade. We’ve written about this before in other asset classes, for example, in STIR markets.
For our specific case, we’re talking about exploiting the spread difference between a CDS and its reference bond. In theory, a bond’s credit spread should match the CDS premium (after adjusting for technical factors like accruals, curve, and repo funding).
But in practice, this relationship breaks down, especially during market stress, funding squeezes, or index roll periods. Traders take advantage by buying the cheaper of the two and selling the richer leg, locking in a spread that converges over time.
Let’s consider Carnival again, with a bond maturing in about five years. The screenshot below shows the spread analysis, with a 159bps yield over the corresponding US Treasury.
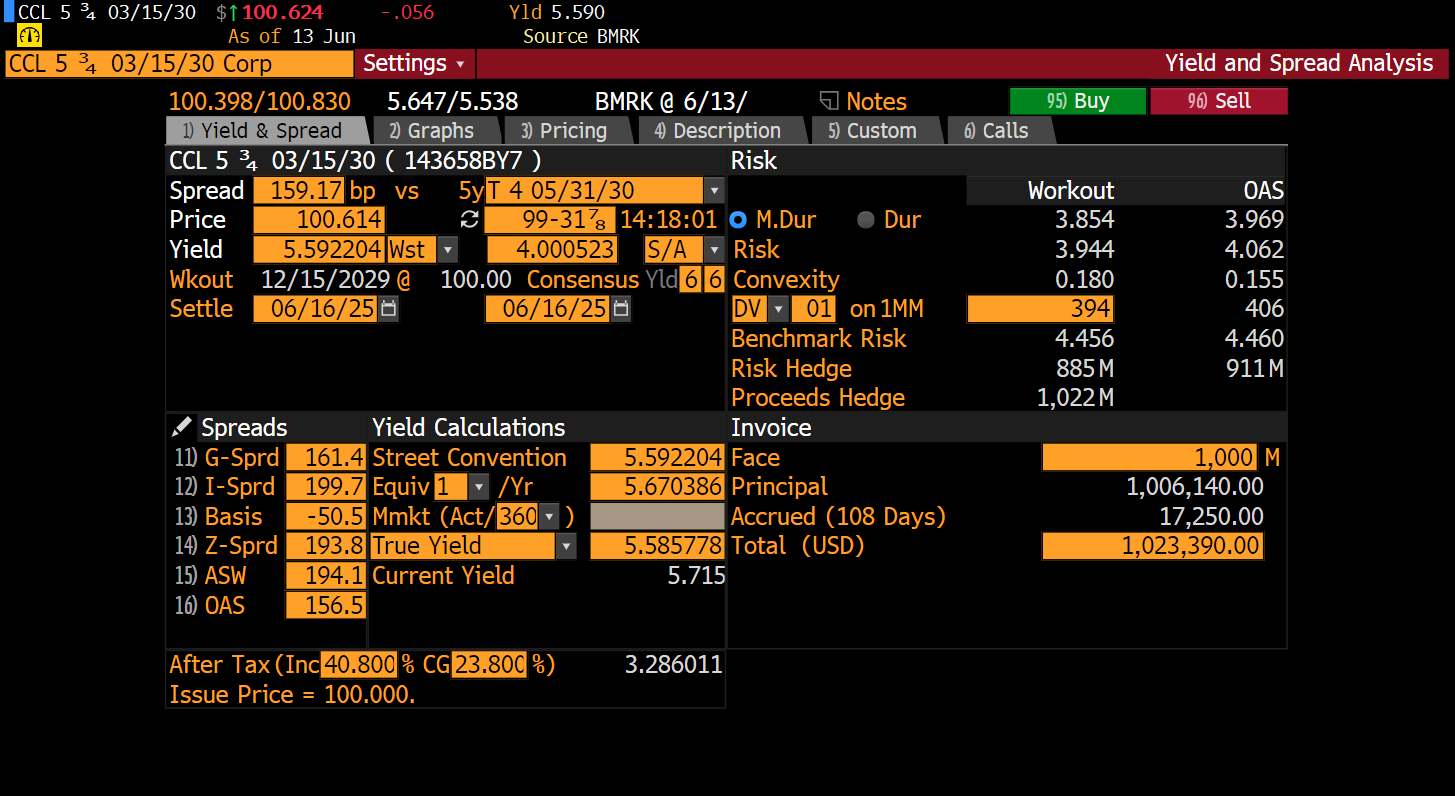
The five-year CDS is at 155bps, which is basically the same as the spread versus the Treasury when factoring in technical factors.
Yet for argument’s sake, let’s assume the CDS was trading at 100bps all in, making the bond’s credit spread higher than the CDS. A trader might buy the bond and simultaneously buy CDS protection, capturing the positive basis as carry and expecting the spread difference to tighten over time.
Curve Trading:
Credit curves, like yield curves, are not always linear. Take a look at the curve below for Apple, which shows a steeper gradient in the 2-5 year space while flattening out in the longer term.
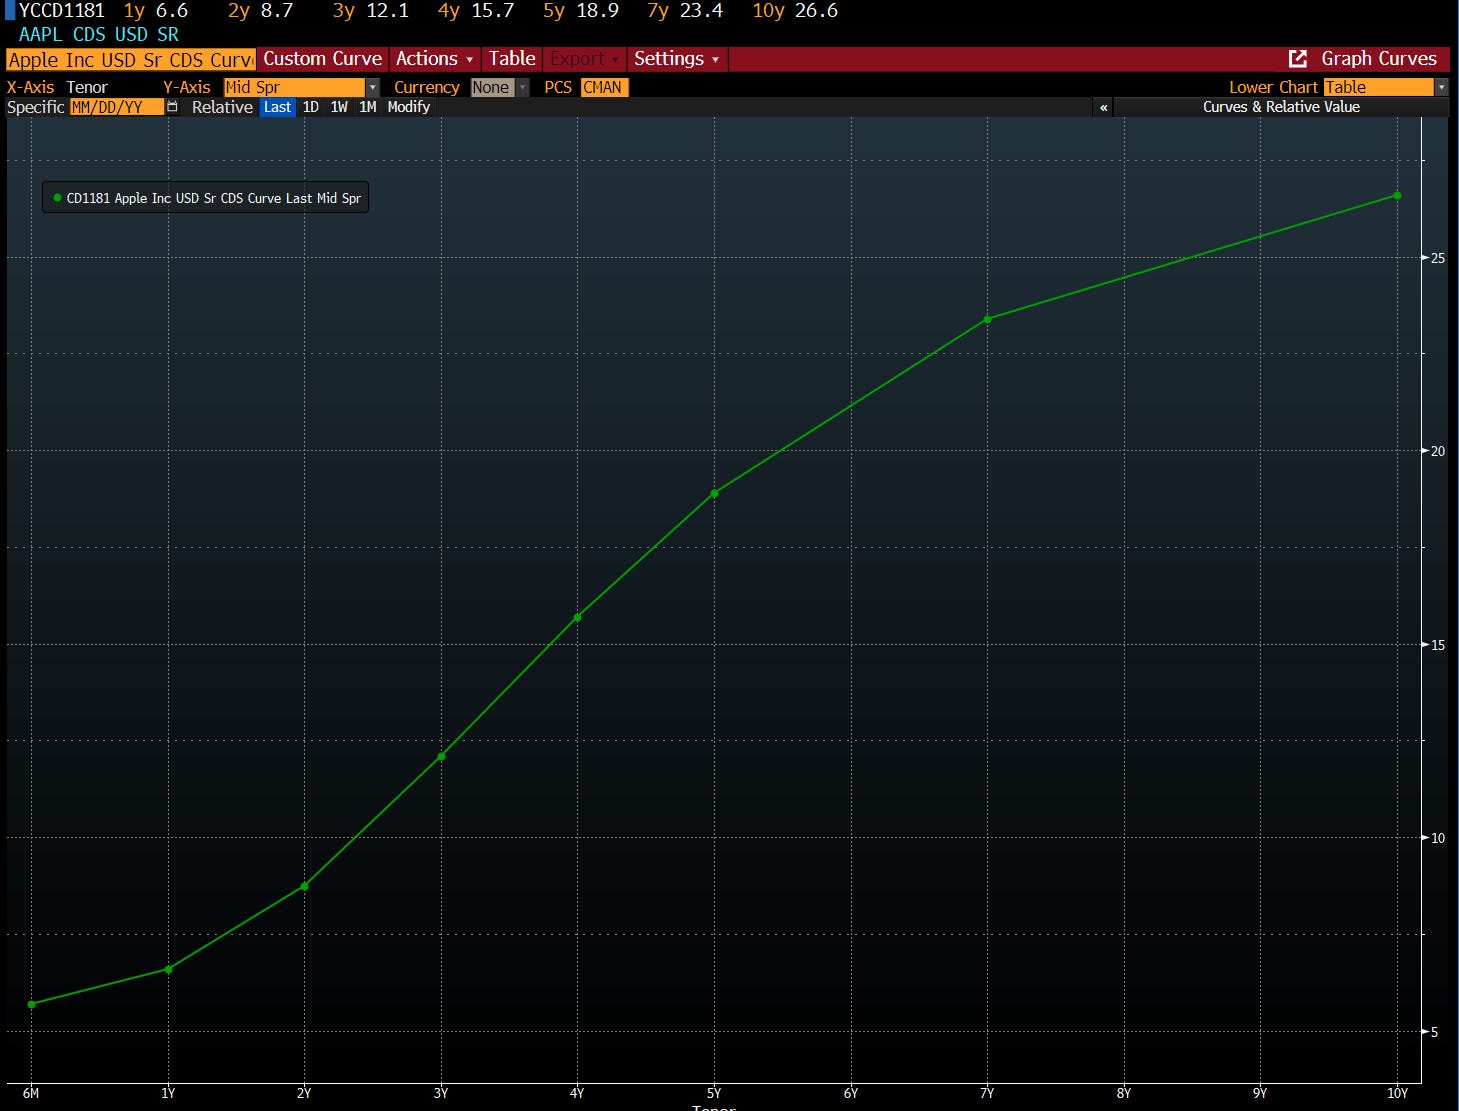
CDS traders often take curve views by going long one tenor (e.g., 5-year CDS) and short another (e.g., 10-year CDS) on the same reference entity.
Key Participants in CDS Markets
A mix of institutional players drives the CDS market, but dealers and hedge funds are the most active and influential participants. Other entities, such as asset managers, insurers, and corporates, engage in more selective or secondary roles.
Dealers and Banks are the primary liquidity providers. They make markets in both single-name and index CDS, manage client flow, and warehouse credit risk. CDS desks typically sit within credit trading or macro businesses and often balance directional views with hedging needs. Interdealer activity also helps set pricing benchmarks, especially around index rolls and event-driven situations.
Hedge Funds are active across speculative and relative value strategies. They use single-name CDS for outright credit views, index CDS to express macro themes, and structured trades like curve steepeners, basis arbitrage, and distressed-event setups. Some funds also trade CDS volatility via options on indices (swaptions), or overlay CDS on equity long/short portfolios as synthetic hedges.
Asset Managers and Pension Funds use CDS more selectively, often in large notional sizes for risk management. Index CDS is the most common tool for hedging portfolio exposure or expressing macro credit views. Some also sell protection on high-grade names to enhance yield, particularly in low-volatility, low-rate environments.
Insurers and Credit Guarantors were once major protection sellers, but their role has become more limited since the 2008 crisis. Today, their activity is more conservative and typically involves capital relief trades or tailored credit risk transfer structures.
Corporates and Sovereign Observers rarely trade CDS directly, but may track spreads as a market-implied signal of creditworthiness or counterparty risk. Their engagement is typically indirect—via treasury teams, IR desks, or macro risk monitors.
CDS in Stress Scenarios
CDS markets may seem technical and peripheral during calm periods, but they move to the centre of the action in moments of stress.
Credit default swaps function as early-warning signals and systemic risk transmission channels. When spreads widen aggressively, it often reflects deteriorating credit conditions. But the feedback loop is circular: the rising cost of protection can amplify fear, restrict funding access, and force position unwinds, exacerbating the very risk it was meant to hedge.
Historical examples:
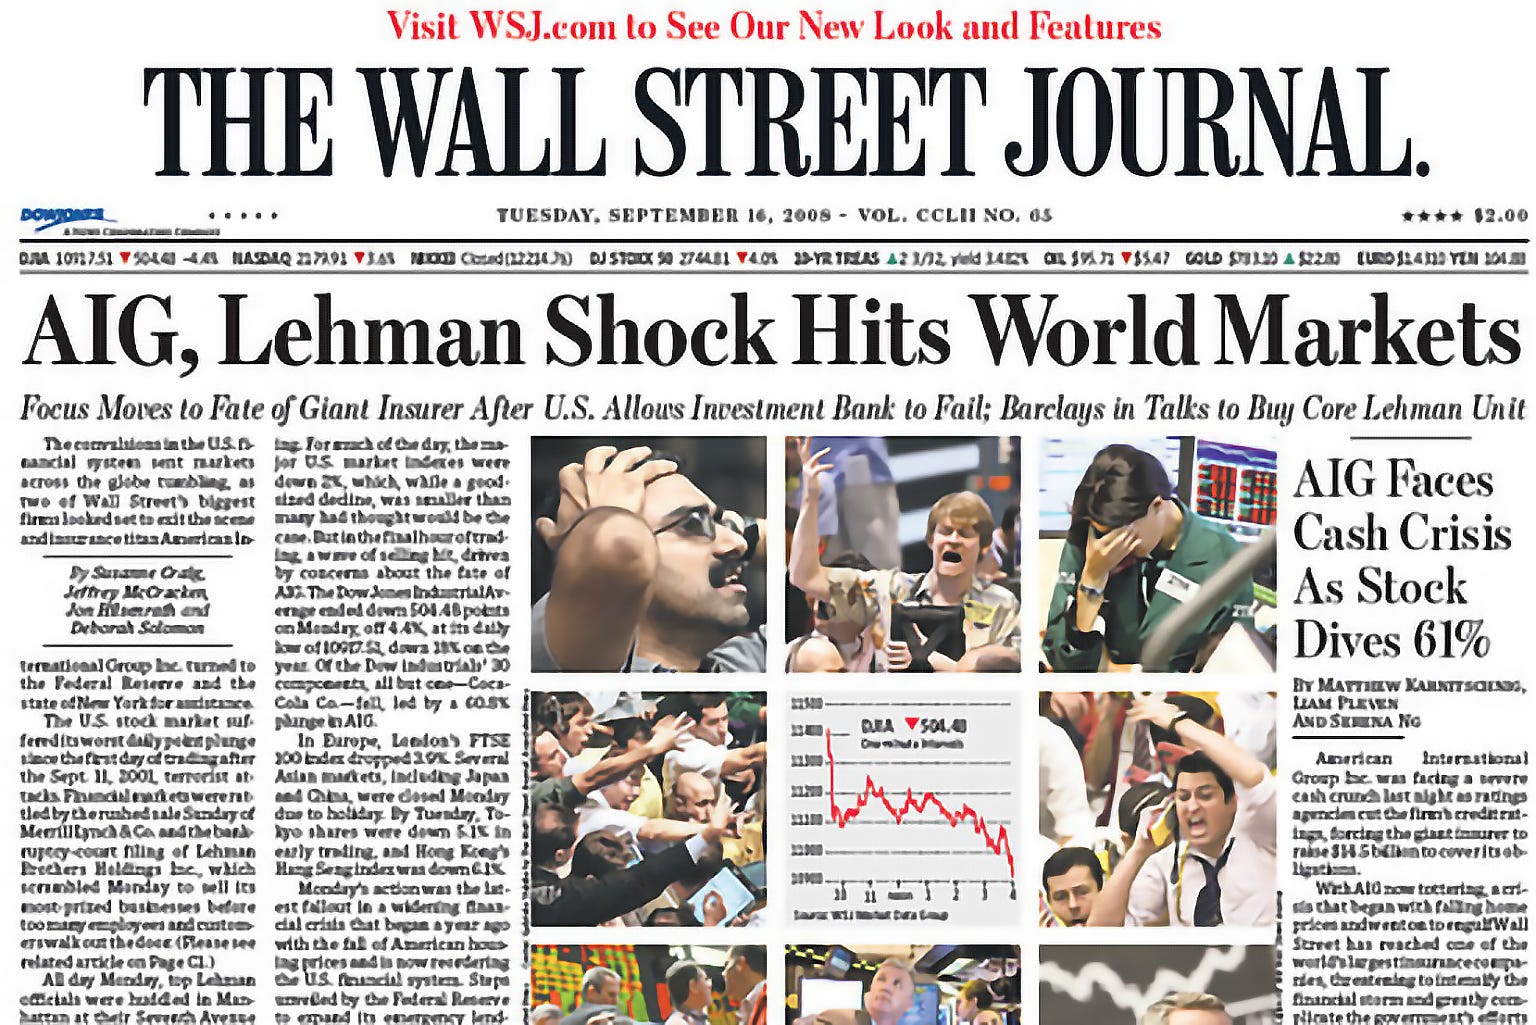
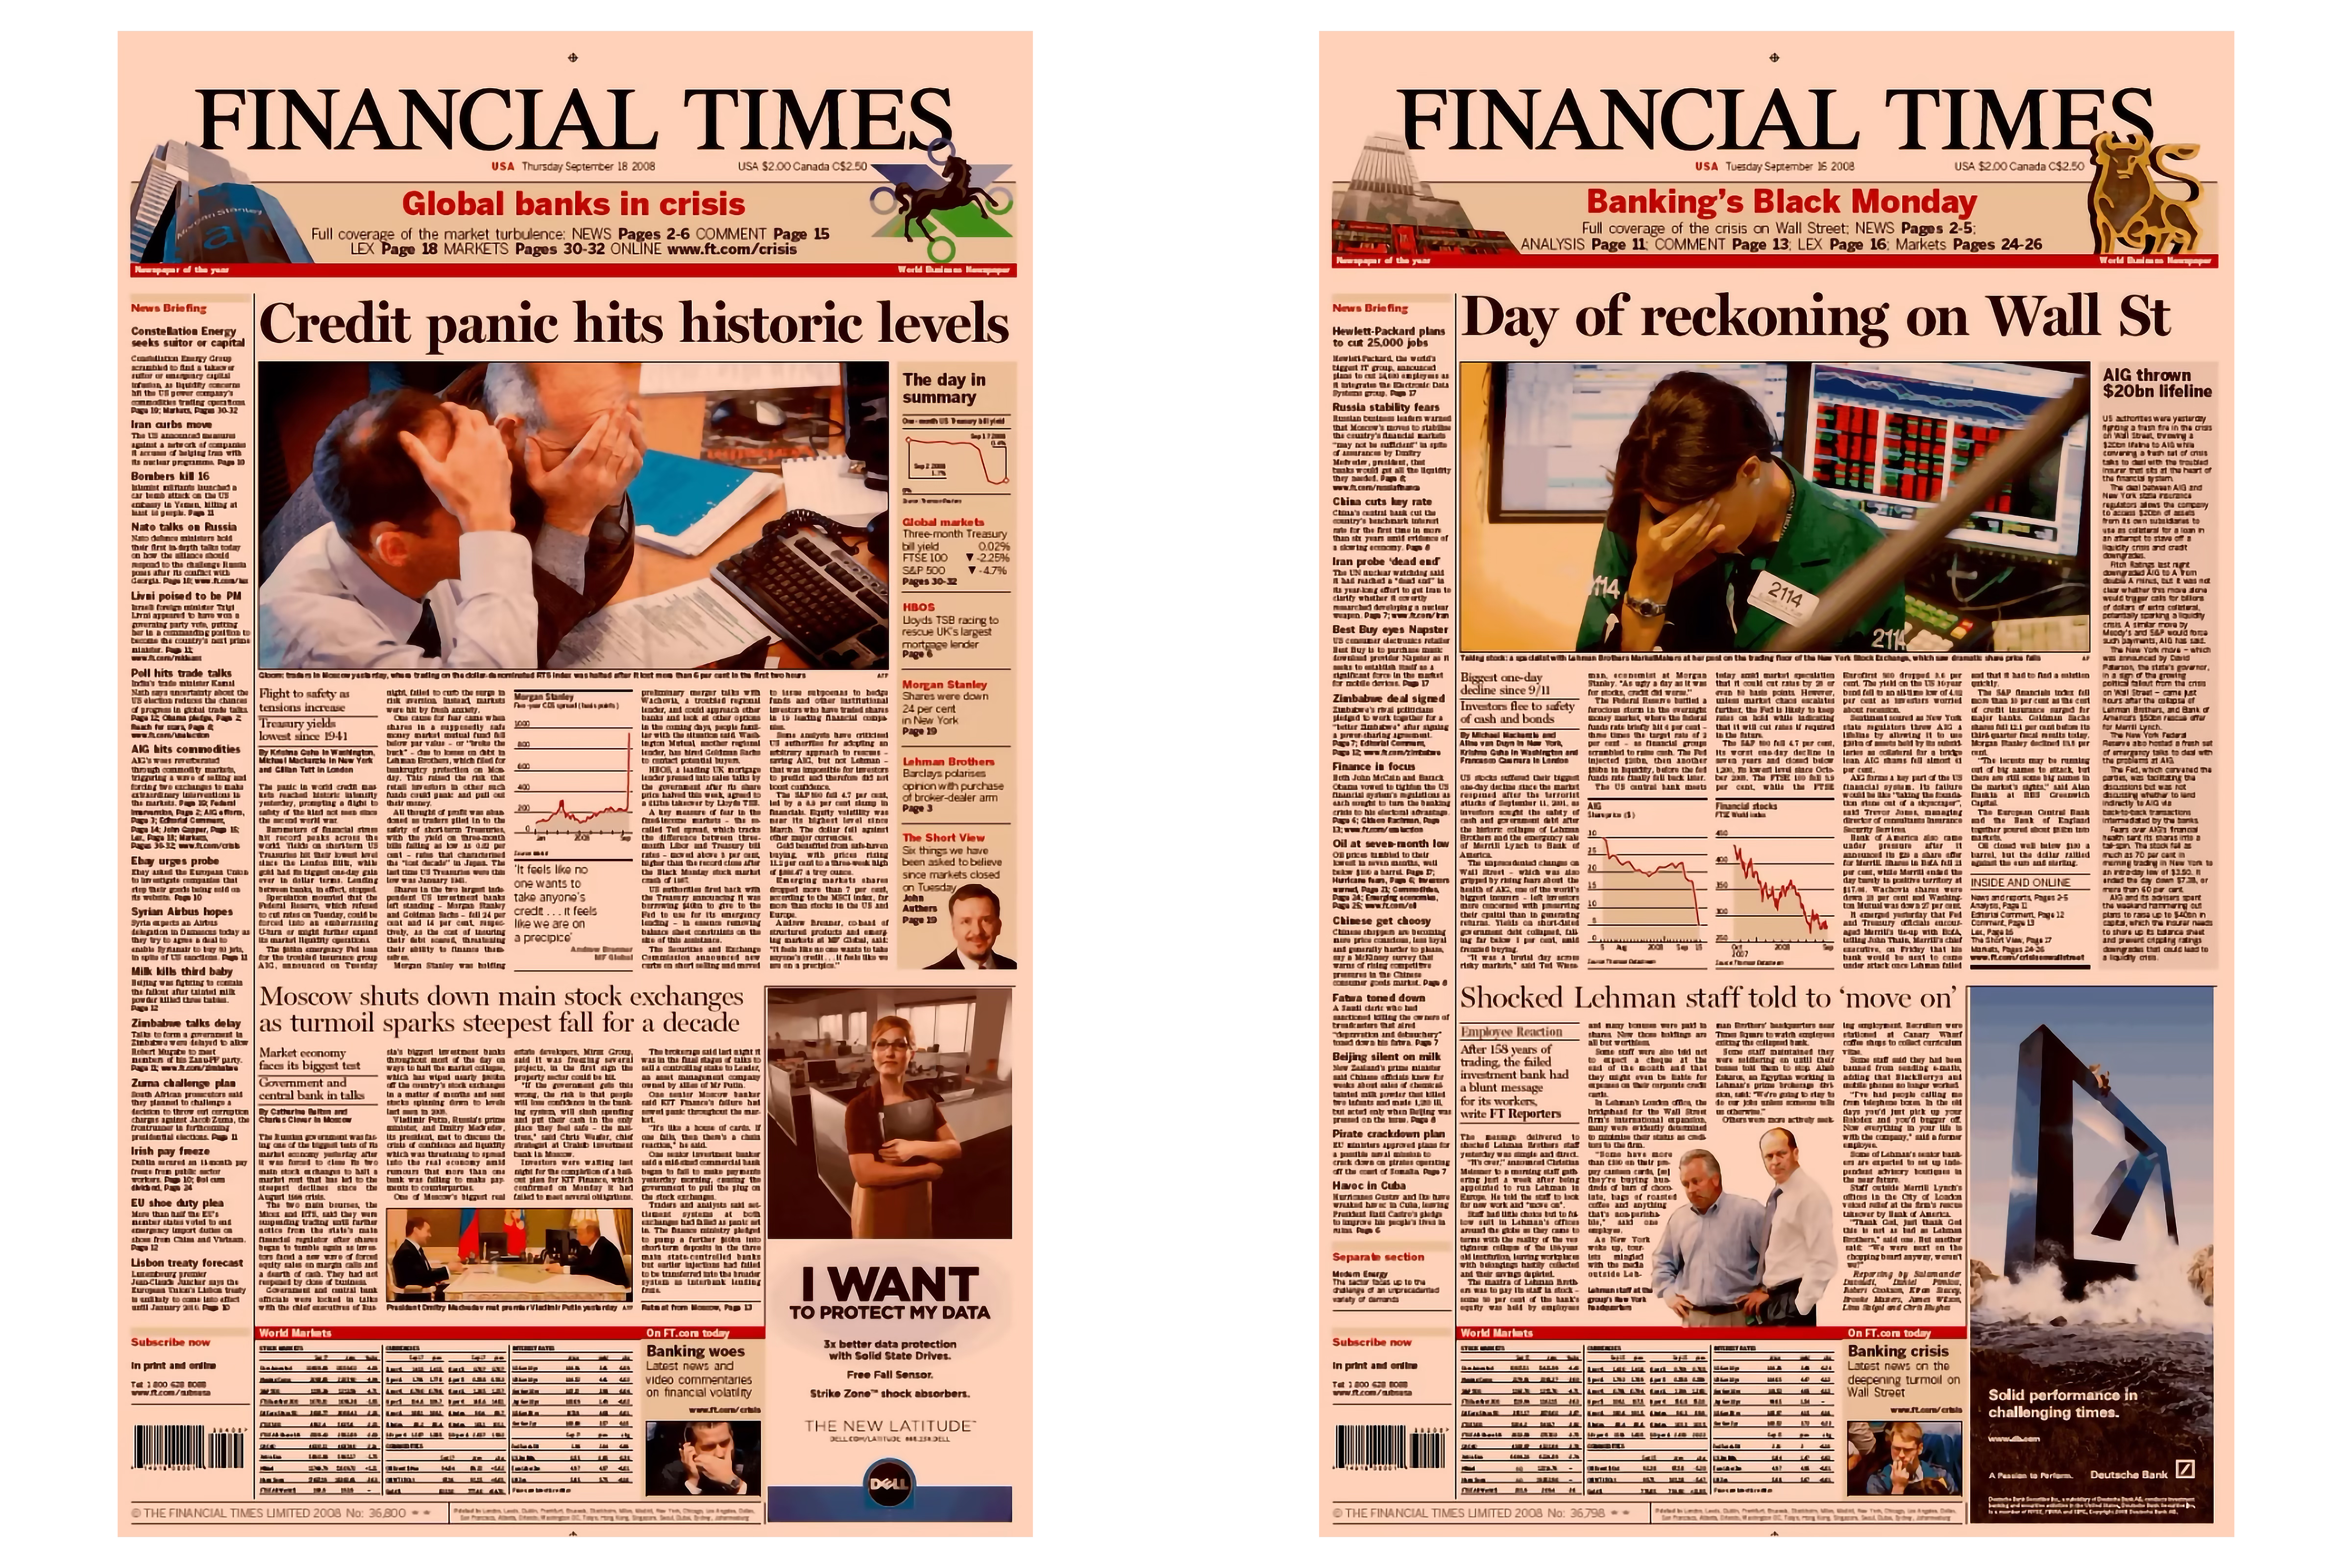
Global Financial Crisis (2007–2008)
CDS spreads on Bear Stearns and Lehman Brothers widened long before equity markets collapsed. They were some of the earliest public indicators of acute balance sheet fragility.
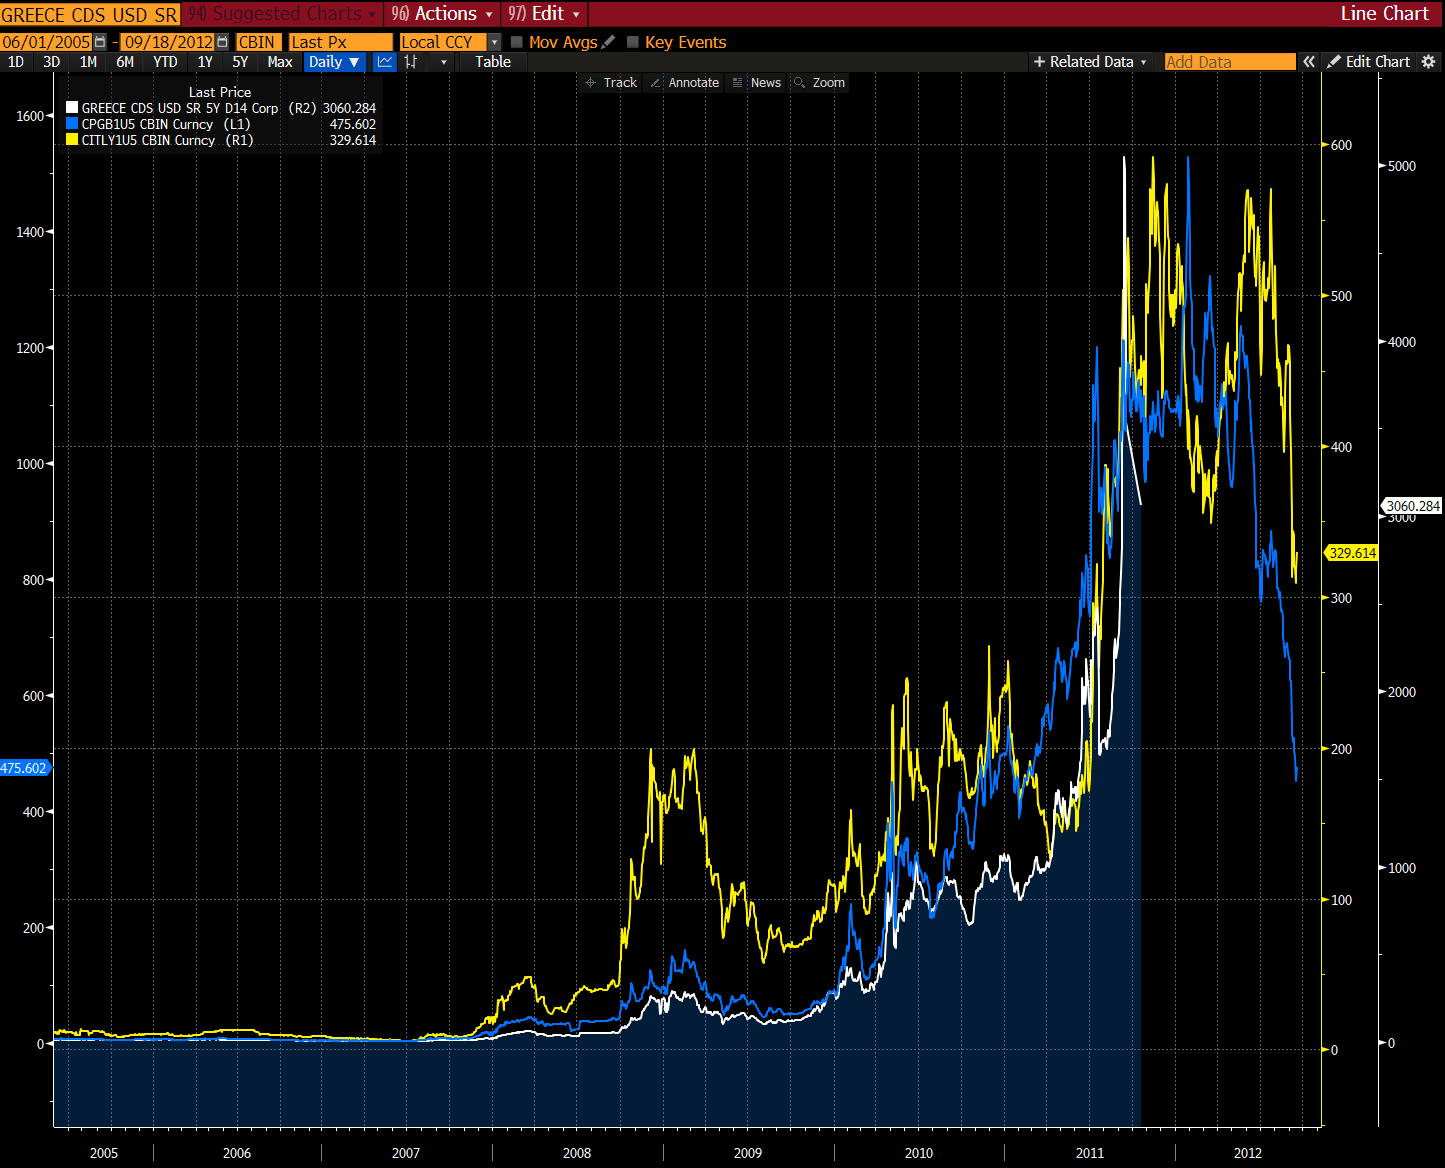
Eurozone crisis (2011–2012)
Sovereign CDS spreads on Greece, Portugal, and Italy signalled restructuring risk months before formal EU acknowledgement.
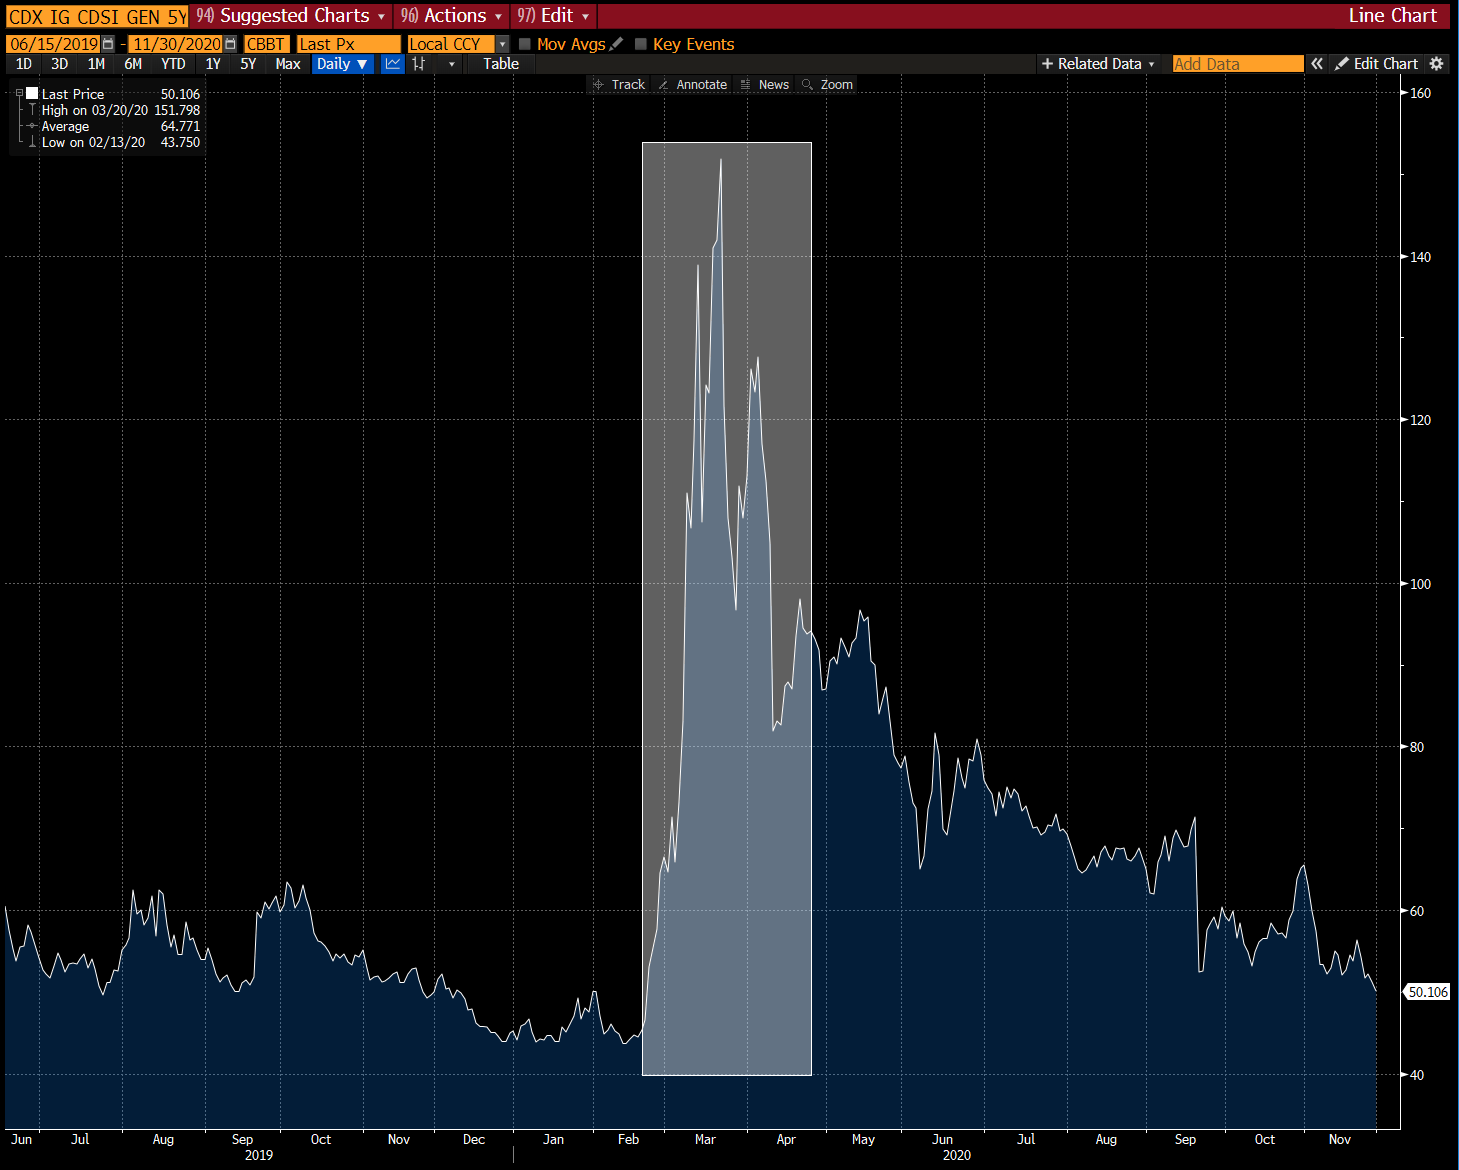
Global Pandemic (March 2020)
During the early COVID panic, index CDS (on both IG and HY) gapped wider in illiquid conditions, reflecting growing concern over mass downgrades and corporate solvency.
Default Chains and Counterparty Risk:
In theory, a CDS seller pays out when a credit event occurs. But in large-scale defaults, especially sovereign or clustered HY names, the bigger question becomes, “Can they?”

This was a central issue during the 2008 crisis. AIG’s collapse wasn’t just about housing; it was about the $440bn of CDS protection they’d sold, much of it unhedged and under-collateralised. When margin calls began, AIG couldn’t meet them, triggering a systemic panic. A $180bn government rescue followed, not just to save AIG but to prevent its counterparties from collapsing, too.
CDS isn’t just about credit—it’s also about who stands behind the trade.
Why CDS Matters for Market Structure and Liquidity
CDS markets may appear niche, but are critical to how risk is priced, transferred, and hedged in modern credit markets. Their role goes beyond insurance. They influence how credit spreads behave, how bonds are valued, and how liquidity is distributed in stressed conditions.
Risk Transfer Mechanism:
At their core, CDS contracts separate credit risk from bond ownership. This allows investors to hedge or express views without trading the underlying cash instruments. A portfolio manager can hedge default risk on a high-yield bond book without touching the bonds themselves. Conversely, a trader can go long CDS to express a bearish credit view even if they don’t hold the bonds.
This ability to unbundle risk supports market efficiency and enhances flexibility in managing exposure across books and institutions.
CDS also allows for more nimble expression of views across capital structures. For example, an investor may prefer to hedge credit risk via CDS rather than reduce bond exposure, especially when the bonds are illiquid or tightly held. In some situations, the CDS may represent the only tradable instrument pricing in default risk with real-time transparency.
Price Discovery and Signalling:
CDS spreads are often seen as a purer signal of credit risk than cash bonds. CDS contracts are standardised, centrally cleared (in many cases), and trade with tighter bid-ask spreads, especially in the index space. In volatile markets or around idiosyncratic events (e.g., earnings, downgrades, or restructuring rumours), CDS prices often move faster than bond spreads, providing a leading indicator of credit stress.
This dynamic makes CDS useful not just for risk management, but also for credit surveillance. Traders, portfolio managers, and even corporate treasurers often monitor CDS levels as early warning indicators for counterparty or sector risk.
For this reason, CDS is a critical input in cross-asset pricing models, counterparty risk frameworks, and synthetic credit instruments.
Credit-Bond Basis and Market Arbitrage:
The relationship between CDS spreads and bond spreads, the credit-bond basis, is one of the most widely watched dislocations in credit markets. Arbitrageurs track this closely, stepping in when the two markets diverge. This dynamic enforces pricing discipline and links derivatives to physical credit markets. A negative basis, for instance, can offer hedge funds a way to earn carry while being hedged for credit risk.
In liquid names, this arbitrage helps tether CDS and bond markets together. In stressed scenarios, a breakdown in this basis can signal fractured liquidity or impaired market functioning.
These basis trades are also closely watched by macro funds, who use them to express broader views on market dislocation, central bank credibility, or systemic stress. The magnitude and persistence of basis gaps can reveal where market plumbing is starting to strain.
Liquidity Backstop in Stress:
During periods of bond market dysfunction, especially in lower-rated or high-yield names, CDS often remains more liquid than cash bonds. Investors who struggle to offload bonds during a sell-off may hedge using CDS instead, or trade index CDS as a proxy for exposure. This “flight to derivatives” supports price discovery when underlying bonds are bidless or subject to wide pricing dispersion.
In that sense, CDS markets often act as a last-resort liquidity window. When bond markets lock up, CDS can still print—a critical feature for anyone needing to offload risk in real time.
Conclusion
Credit default swaps remain among global finance’s most important yet misunderstood corners. To some, they’re just insurance. But in practice, they sit at the heart of how credit risk is transferred, priced, and managed across portfolios and market participants.
Used correctly, CDS contracts offer precision tools for hedging and speculation. They allow investors to separate credit risk from duration, express relative value views, or protect portfolios against systemic events. They also provide critical price signals, helping market participants navigate credit cycles and manage risk through volatility.
They’ve become a vital part of modern market architecture, not just for trading credit but also for managing capital, aligning with regulatory regimes, and structuring balance sheet exposures across institutions.
Whether running a macro book, managing an IG bond fund, or watching counterparty risk at a bank, CDS markets sit close to the core of how credit is expressed and defended.
From bank balance sheets to high-yield ETFs, from structured credit desks to pension funds, CDS markets touch far more of the financial ecosystem than most realise.
We hope you enjoyed this primer and insights on credit default swaps. Please leave a like to show your support. As always, comments and opinions are welcome.
AP
Credit event: A defined trigger in a CDS contract (such as failure to pay, bankruptcy, or restructuring) that obligates the CDS seller to compensate the buyer.
Thank you for the fascinating article. What is the best website or index for a macro enthusiast to follow the CDS of USA and European countries?
If it wasn’t for me watching “the big short”, this would’ve been hard to follow. Thank you for writing this easy-to-follow primer on an obscure financial instrument.