

H2 Macro Trades Playbook
As we move into the second half of the year, it's time to get our thinking hats on.

When July 1st comes around, it seems to always serve as a reminder that time is going by faster than you realise. We’re halfway through the year, and these last six months felt even quicker than the ones preceding them, right?
But in the small office of the AP team, it also reminds us to get our thinking caps on. Why? H2 is underway, and it’s time to start noting down our thematic speculation.
Rate cuts were meant to be the big story in 2024. Technically, they still have been, but for different reasons than most thought. The biggest themes of 2024 may still be to come. Some new, some old.
If you are a new reader, or maybe you’ve been here for a while and you’re intrigued to know what is behind the paywall on each article, you can access a 14-day free trial on the button below.
Five themes for consideration. Here’s what we’re thinking.
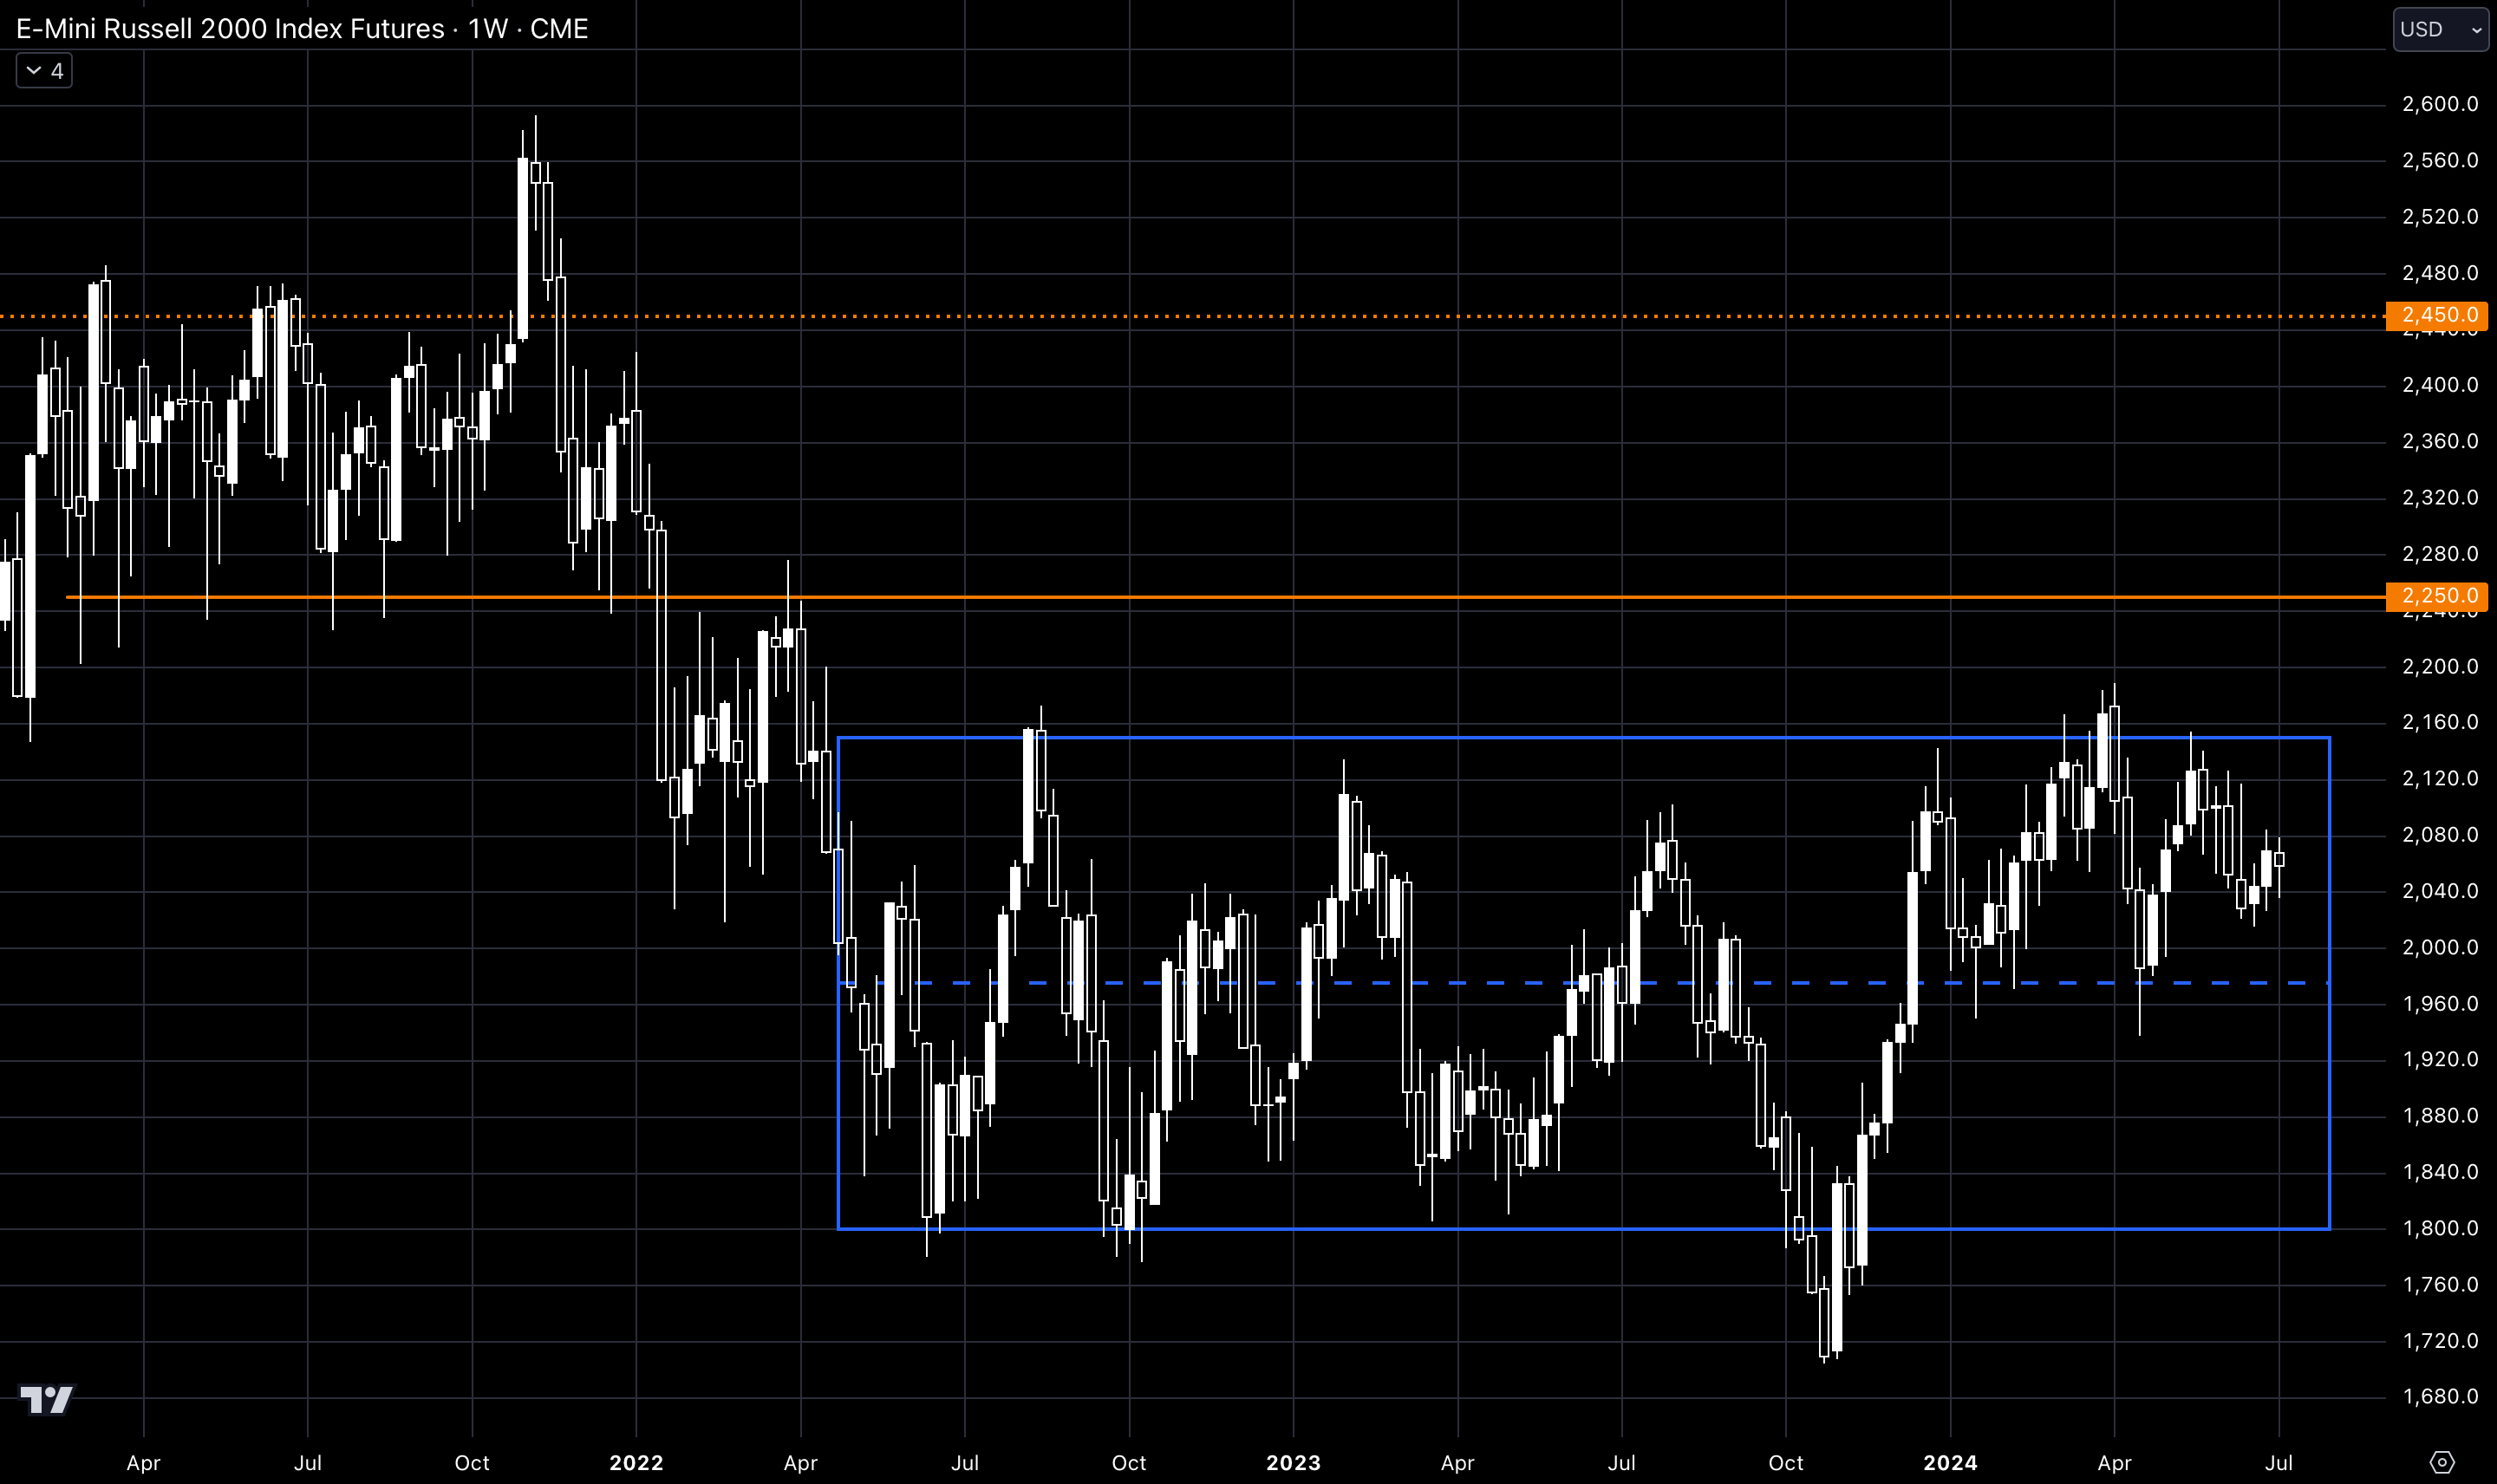
US Small Caps
As markets began to price in 2024 rate cuts more aggressively at the start of November last year, US equity markets rallied. The S&P rose 15% through to the end of the year, while the Nasdaq gained just shy of 20% in those two months. However, it was small-cap stocks, the Russell 2000 Index, that won gold. The index gained 25%.
Outlooks changed quickly to start the year. As rate cut expectations were reduced, small-cap stocks fared the worst, while their peers, S&P and NQ, continued their journey higher.
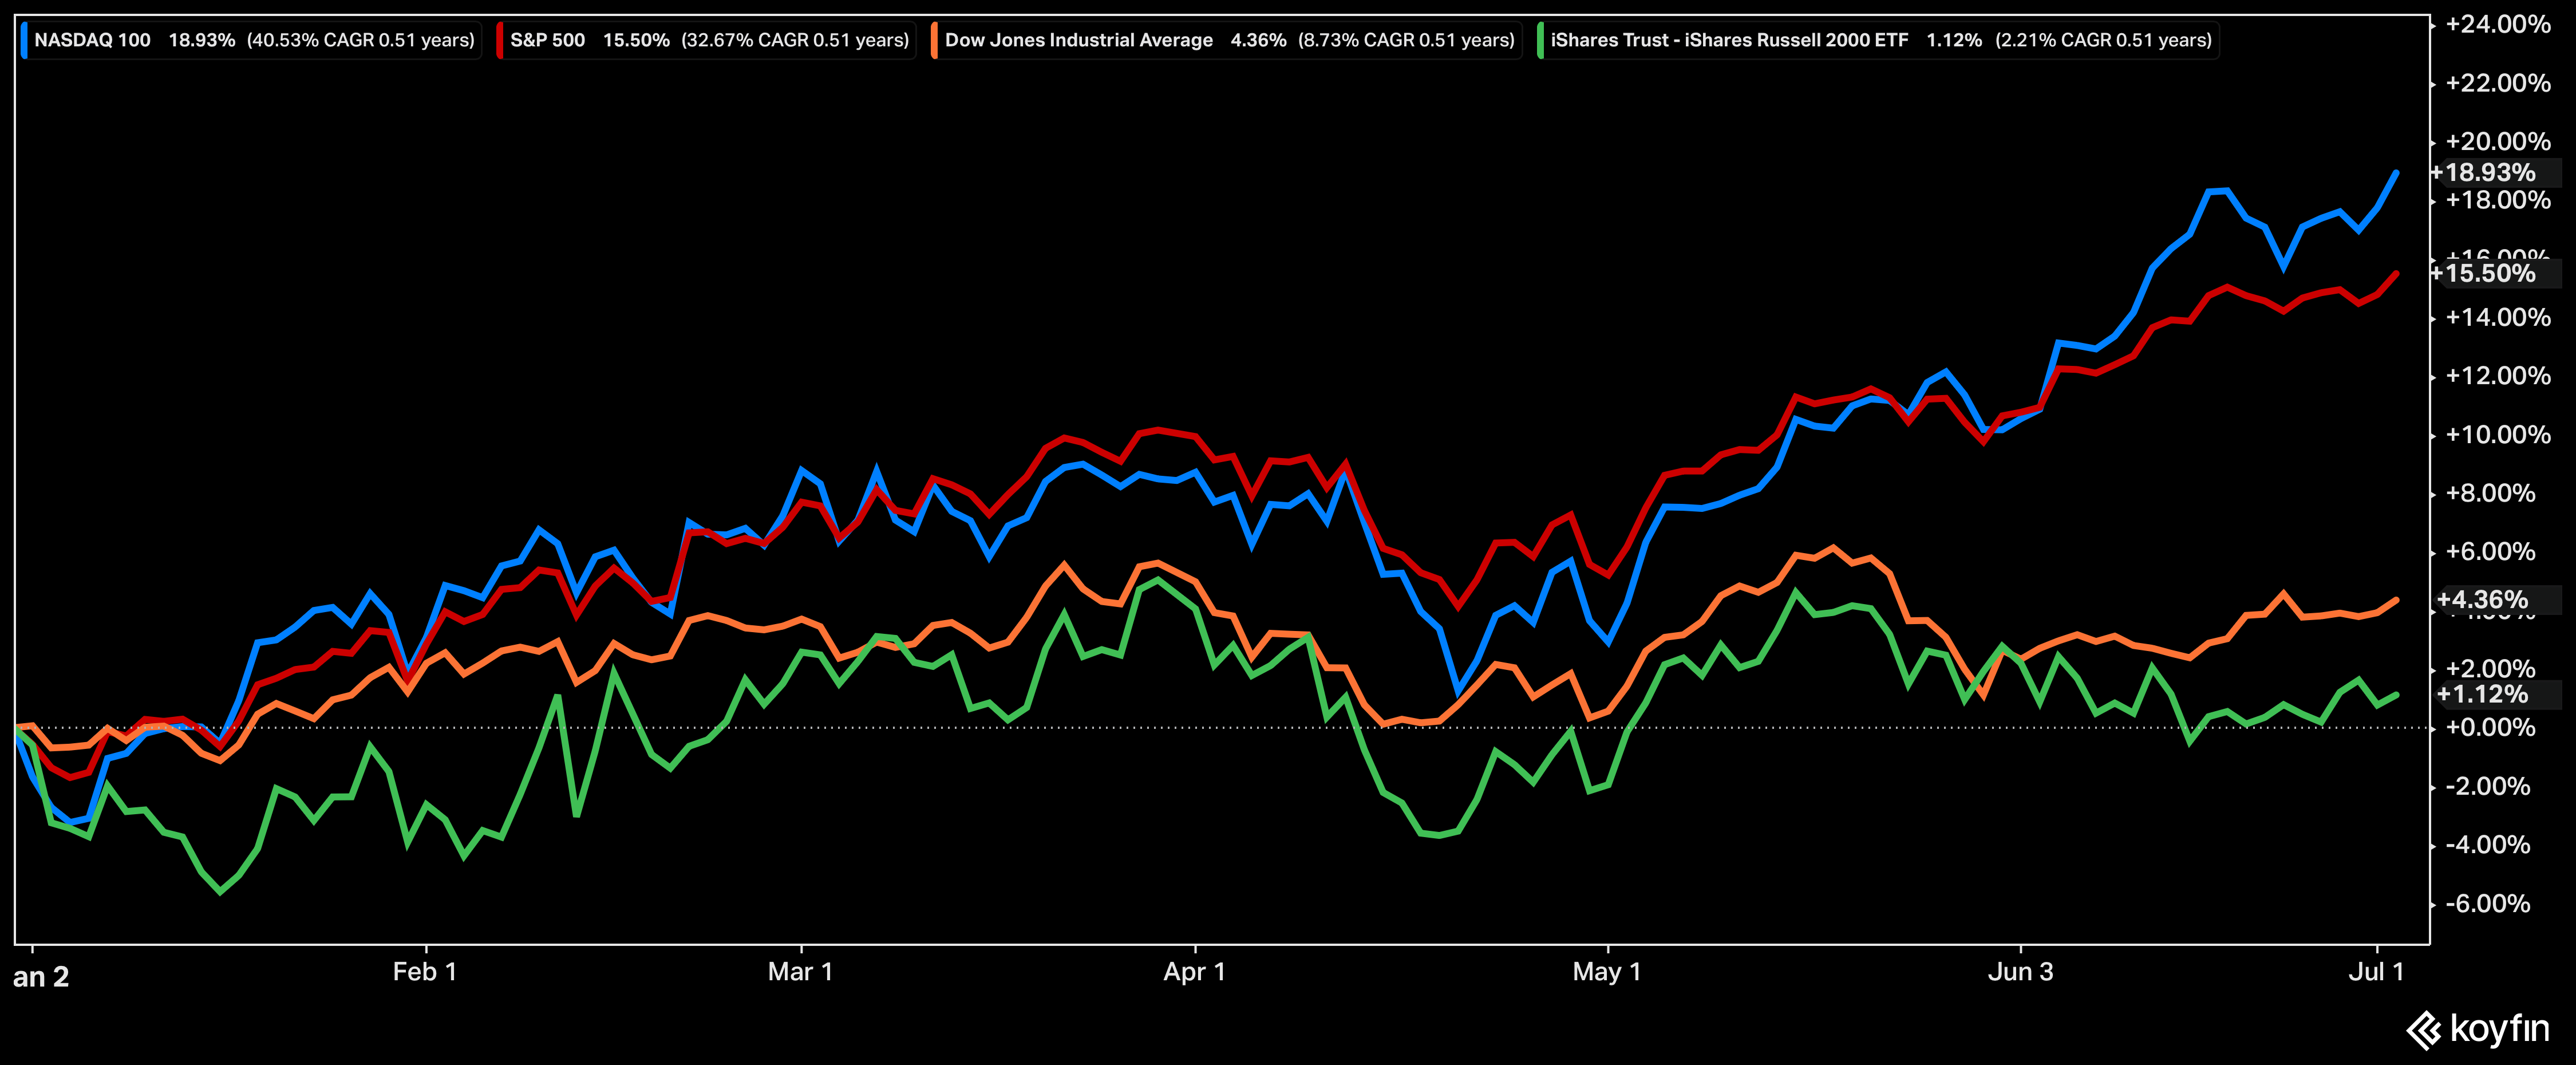
As the halfway point in 2024 passes us, the Russell 2000 is pretty much flat.
Why is an underwhelming index making its way into a “Trades to Watch” list for the next six months? Rate cuts, although now a different story to the one originally expected in 2024, will be coming.
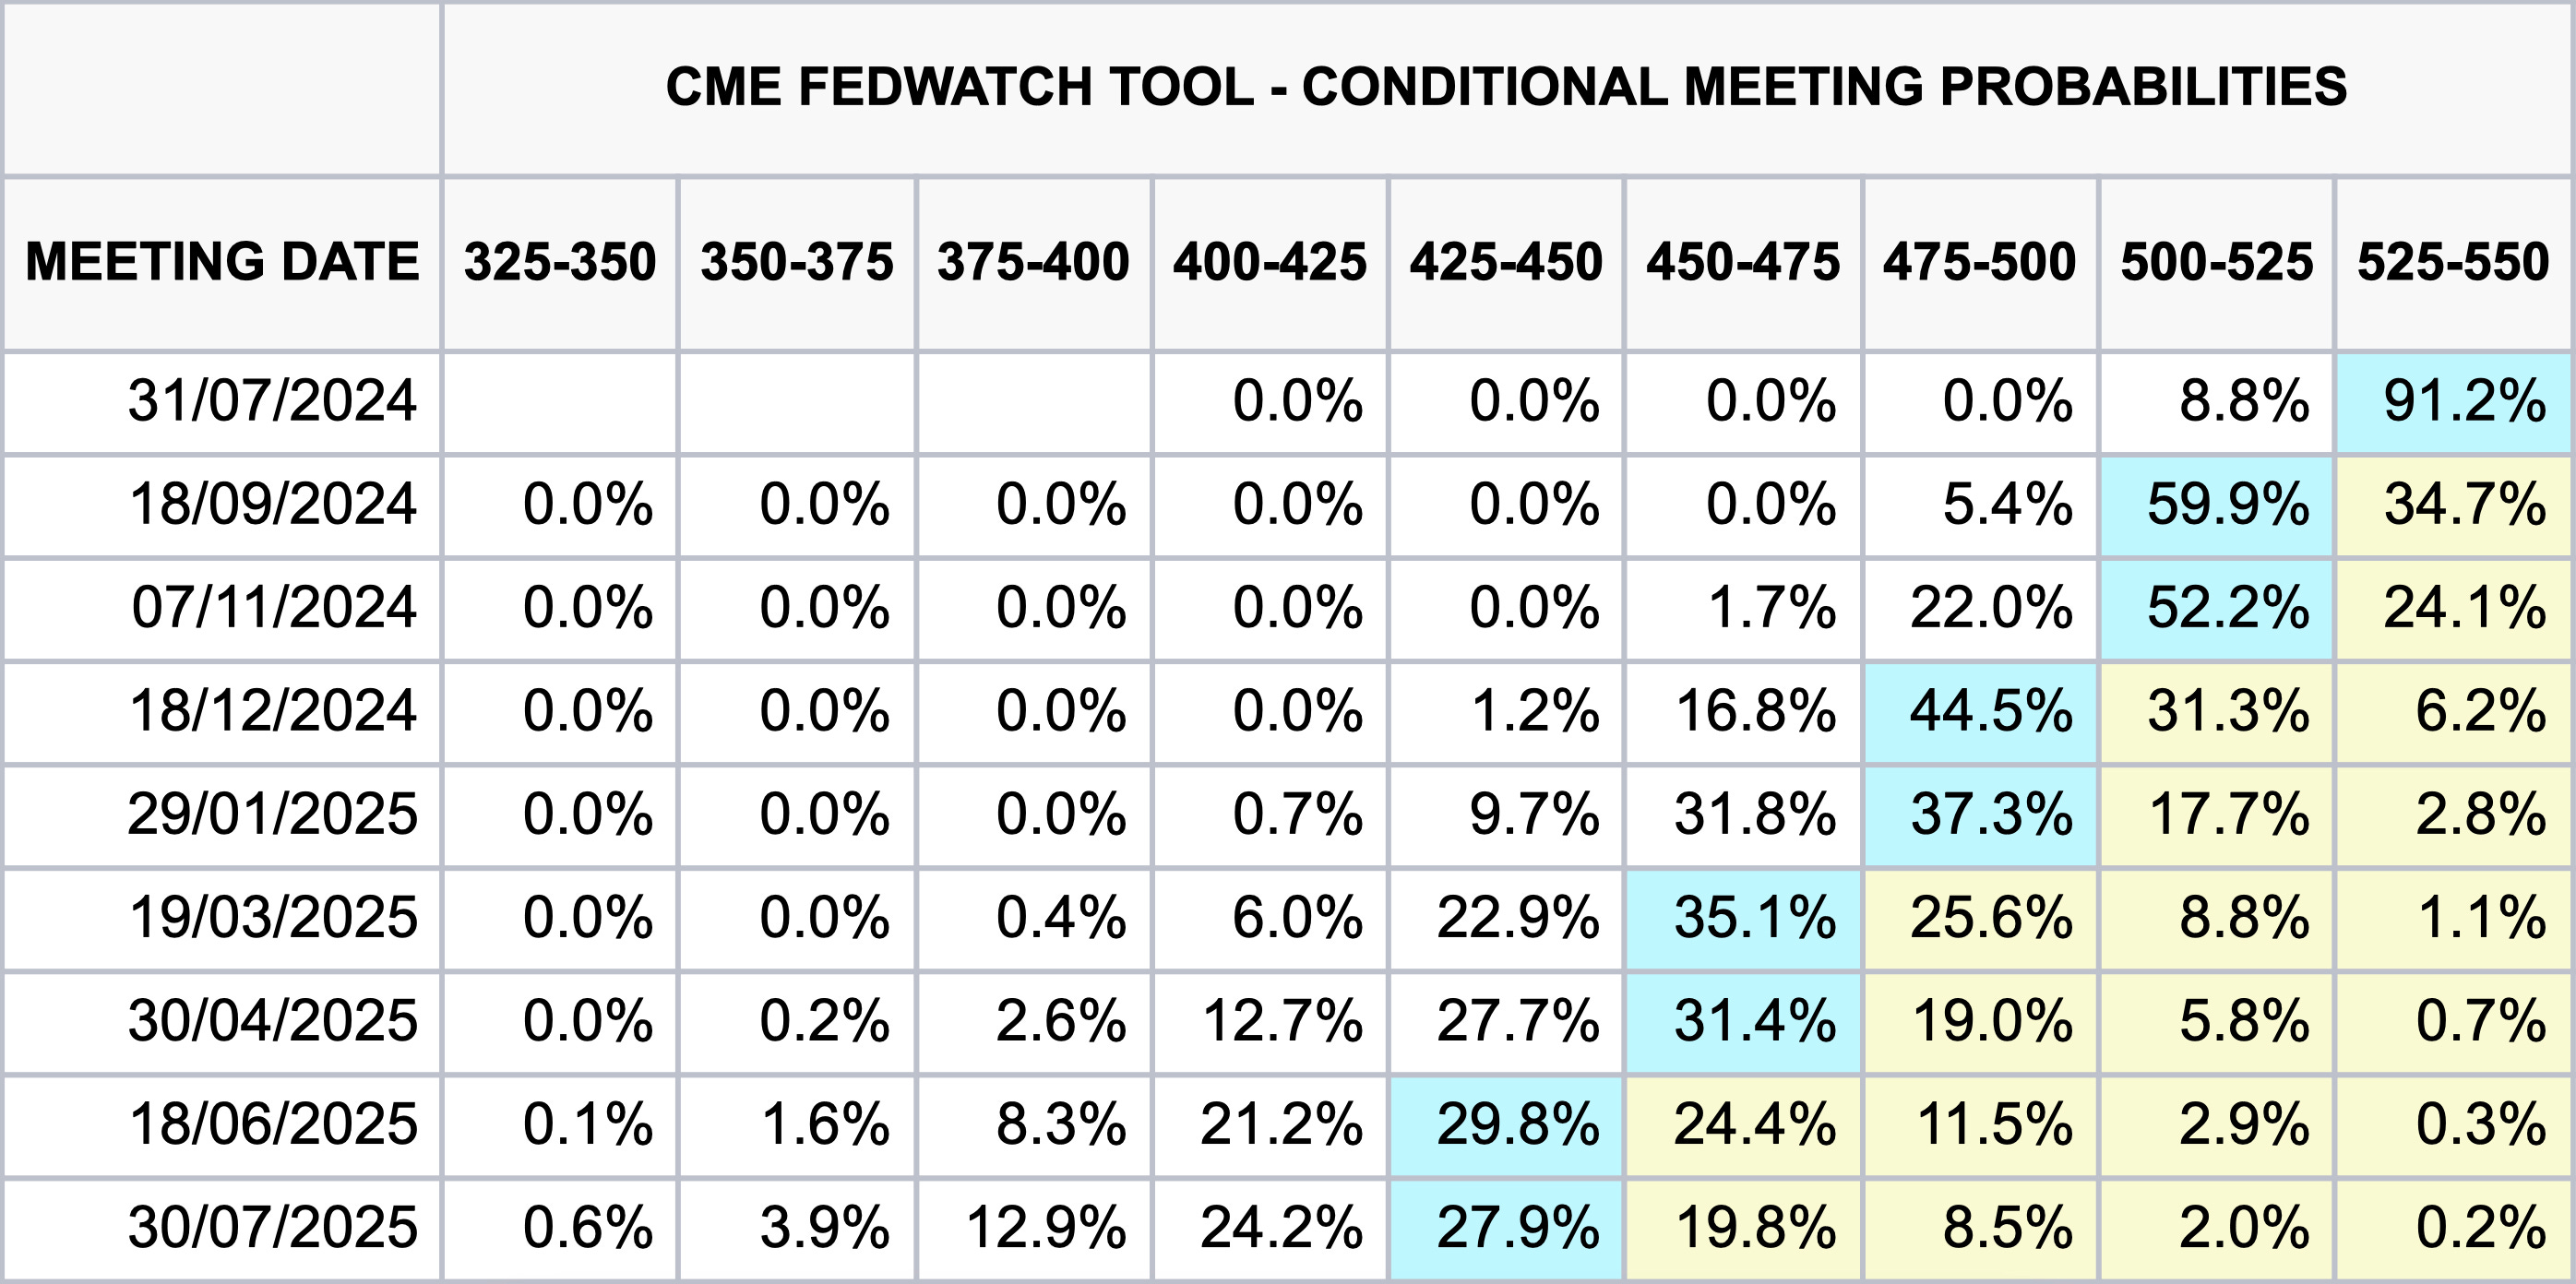
Markets expect the first quarter-point cut to happen at the September FOMC meeting, with the second cut to come in the December meeting. There will be a time before the September meeting when yields cool, and this will serve as a tailwind for this index.
We expect RTY to break above recent highs in the latter part of the year, moving past 2,250 after that. That only represents a 9% return from current levels. However, this is our base case, and we believe there is an opportunity for small caps to outperform this and close the year higher.
Commodity Continuation
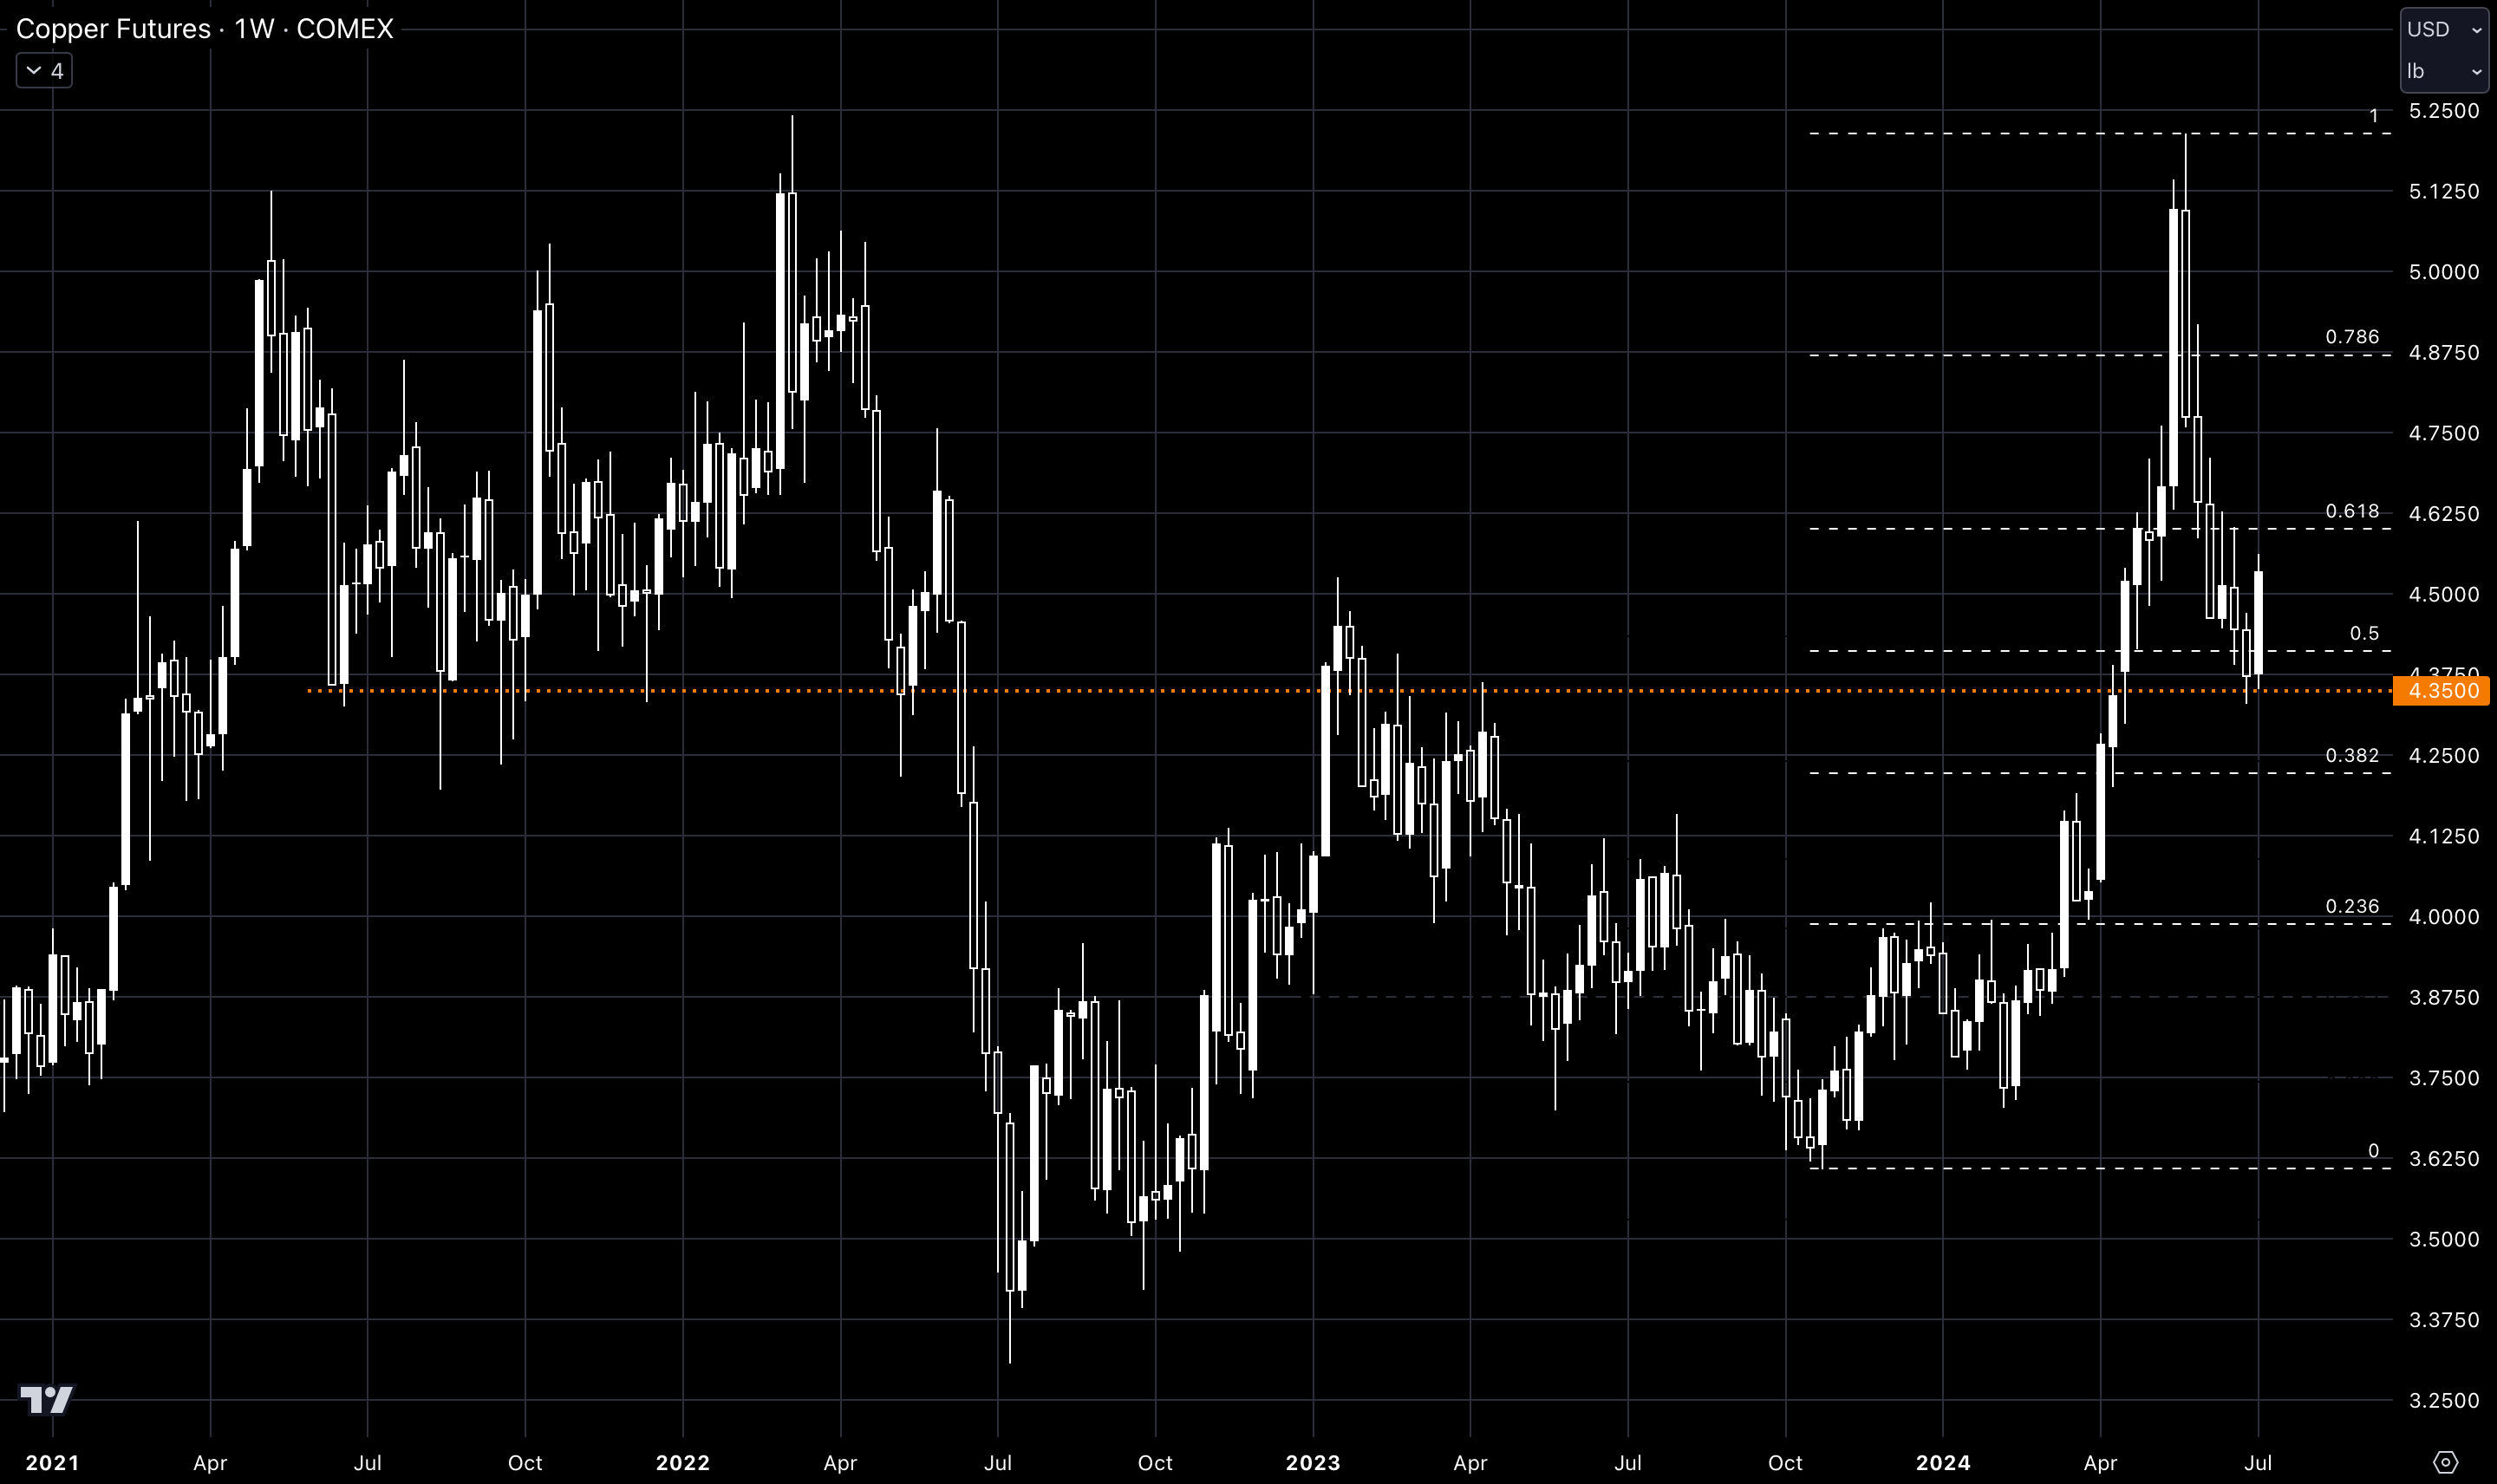
Commods were amongst the best performers in Q1. PMs and oil were all the craze. While PMs continued their move higher to start Q2, oil pulled back. Call it May 21st (white line on the graph below), PMs joined the pullback, and most ended Q2 flat. A quarter that fell short of expectations, but this is not a bad setup for continuation.

Where in the commodity markets are we looking? Mainly towards PMs. Oil has more unpredictability with OPEC’s control over supply. Although we often dip our toes into the crude pool, long or short, it’s harder to say how we would play it over a six-month time frame. We focus more on the short-term moves.
But within PMs, there are two that we lean towards to make a strong return in the coming months: Silver and Copper.
We’ll just touch on copper quickly, as we gave a more in-depth article back in May on the matter. You can read that here:

Copper demand is on the rise. This is expected to drive up copper prices over the short and medium term as the current increased demand is expected to far outweigh supply growth within the industry. Maybe we see a Goldilocks scenario of some “copper shortage” headlines getting thrown about. The traders then get involved and it becomes mania. Look at cocoa as an example of this just a few months back.
However, we are cautious that China plays a big role in this play. A potential deceleration in the Chinese manufacturing industry has the capacity to promptly influence price trends.
The pullback in PMs we mentioned earlier… well, that was noticeably seen in copper. A 50% retracement in the move higher that started at the end of last year. Pullbacks offer opportunities to get long on trends. Better to be adding on pullbacks of strong trends than to be chasing it at swing highs.
According to projections, the silver supply deficit for 2024 is expected to surpass 2023’s deficit due to insufficient silver production. Some argue that by deducting net investments in silver exchange-traded products, the market’s deficit becomes apparent.
It is estimated that mining production will increase by approximately 4% (at 843 million ounces) and consumption will range between 1.2 to 1.4 billion ounces. This is attributed to the demand surge driven by technological advancements such as electric vehicles, solar panels, and wind turbines, all of which rely on silver. As a result, there will be a significant supply shortfall.
Although this thesis is based on a wider timeframe than six months, this has been, and will continue to be, the driving force behind the move higher.
Unlike gold which is trading at ATHs, silver has been at these prices before (and even much higher prices at that). Why silver and not gold? The spot gold/silver ratio started at 90 this year but has trended down to 80 (a lower ratio signalling an outperformance in the denominator). We believe this trend will continue, and silver will offer higher returns than gold.
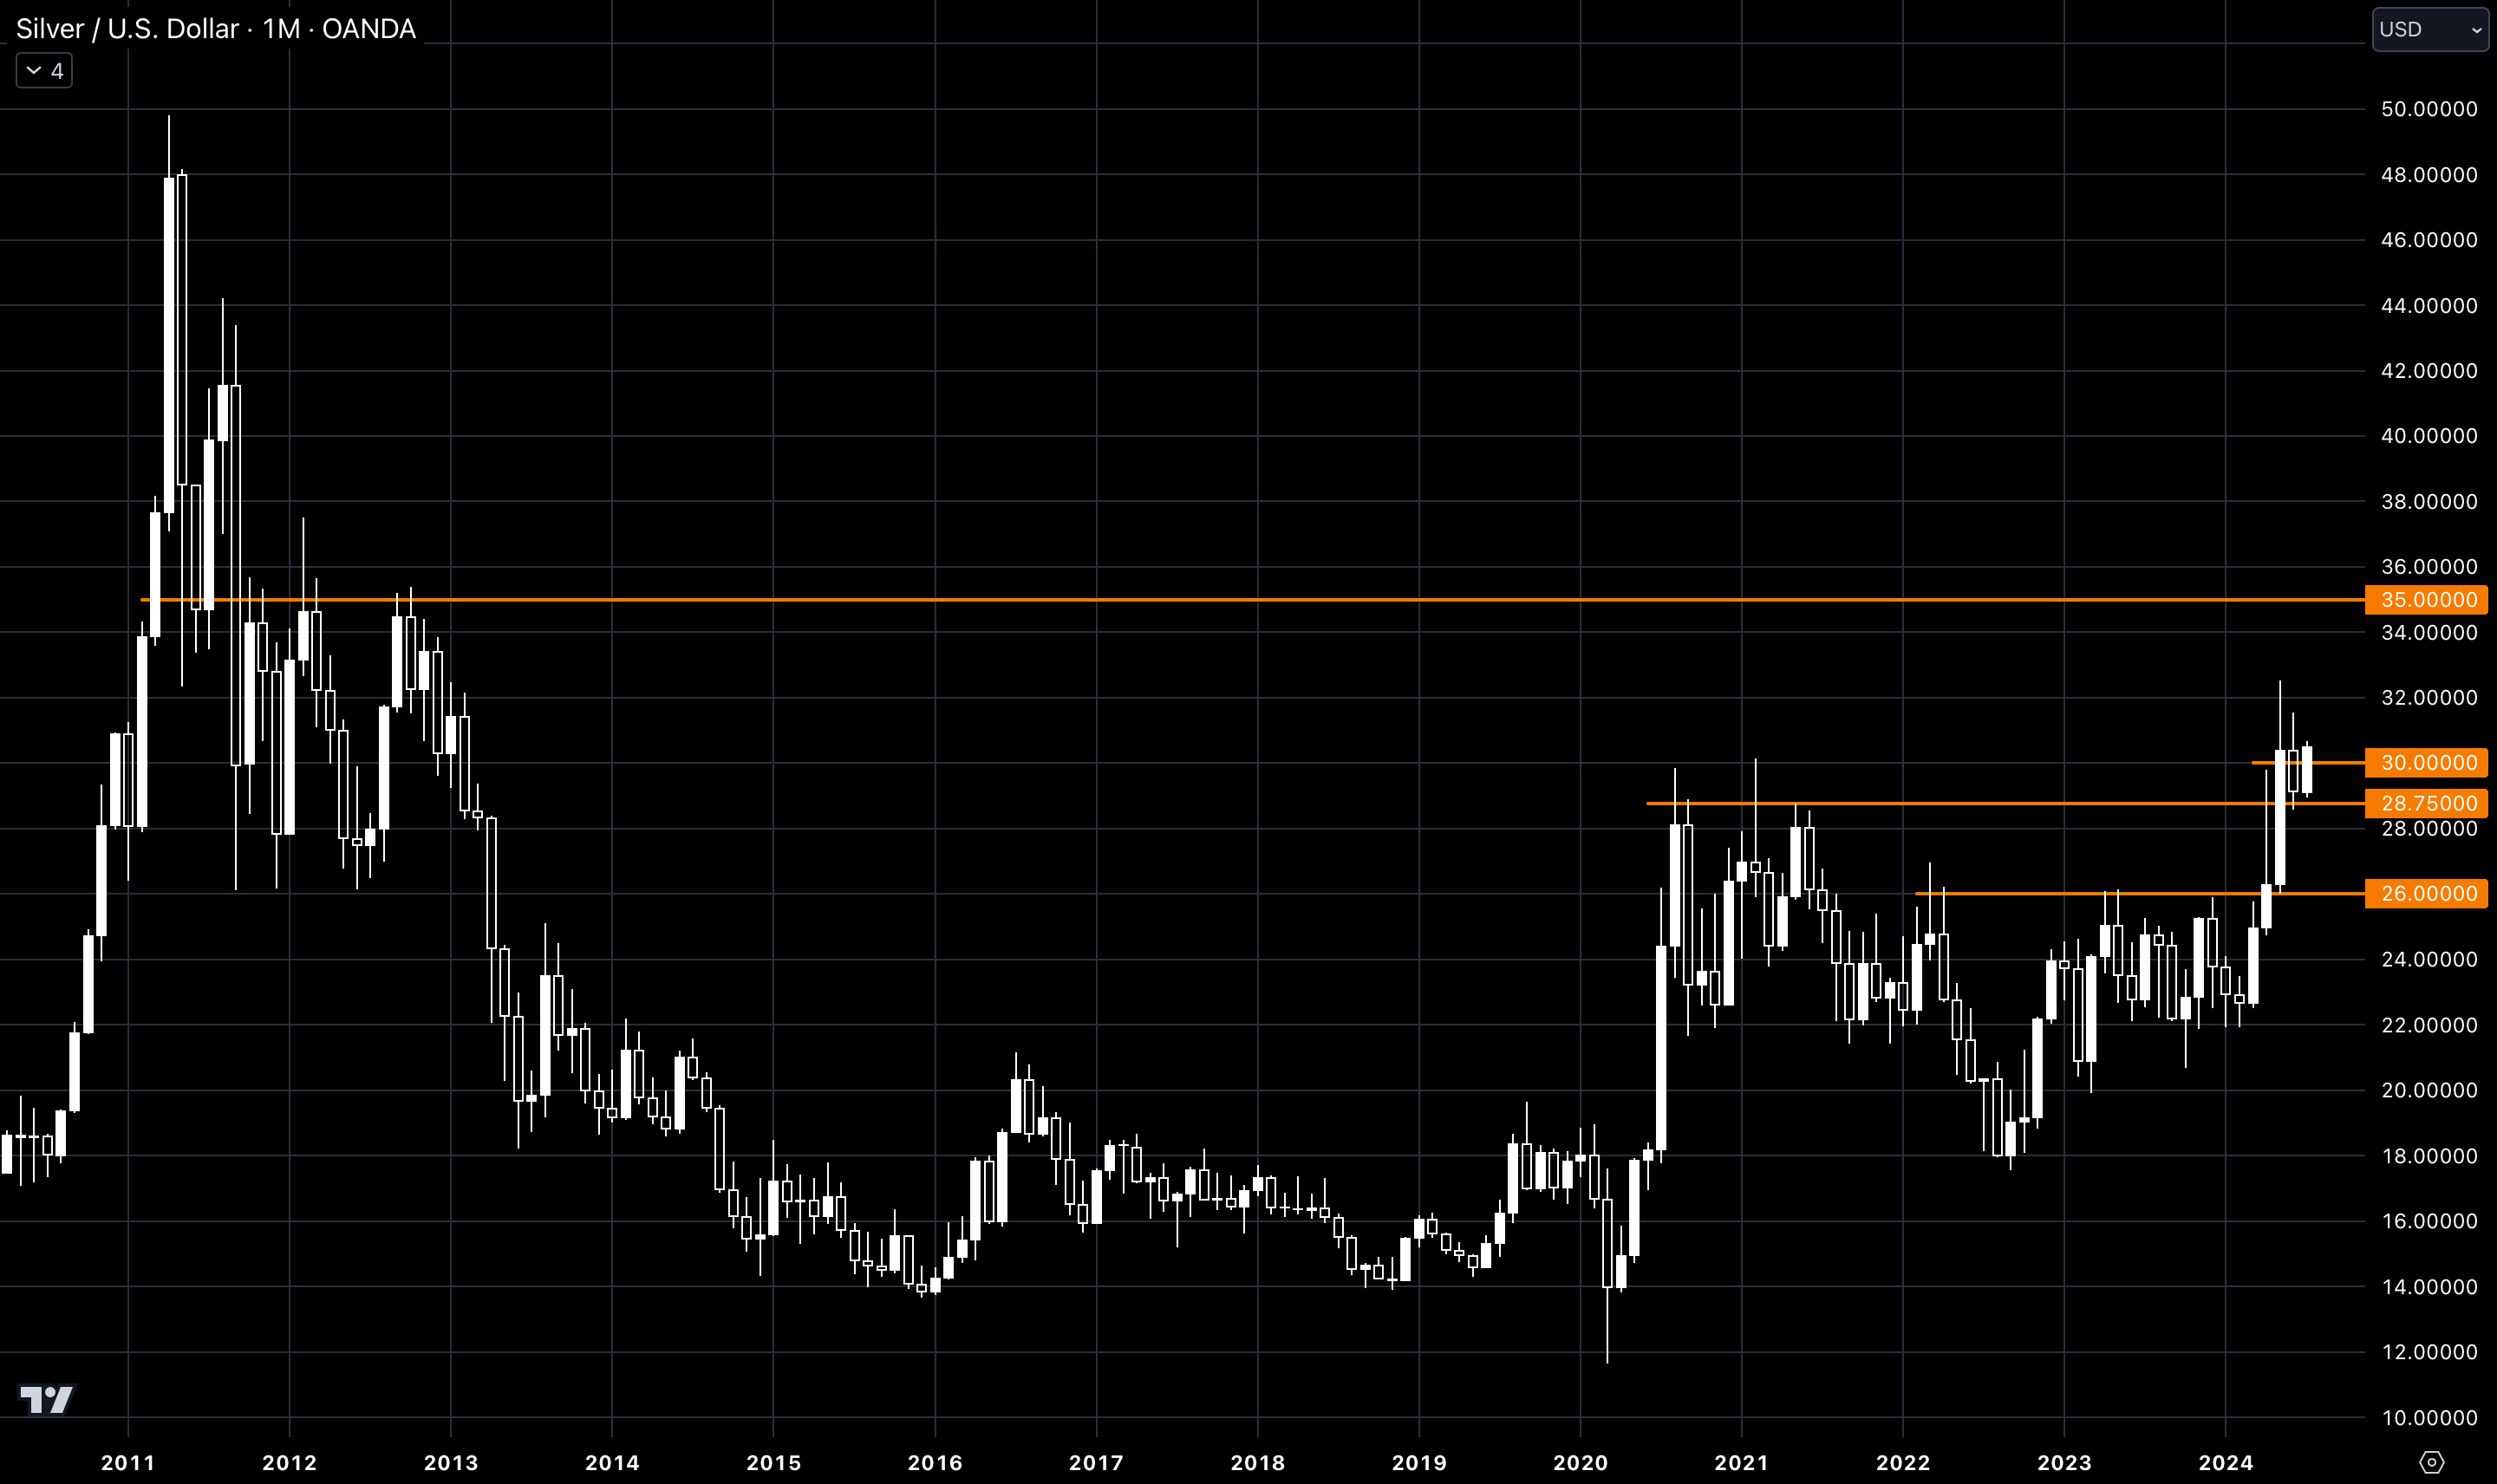
Another tailwind of the commodity trade is the dollar. As rate cuts from the Fed arrive, the dollar becomes less attractive for investors, decreasing the price. A decreasing dollar can play a strong role in metals pricing, much more so than is seen in other asset classes.
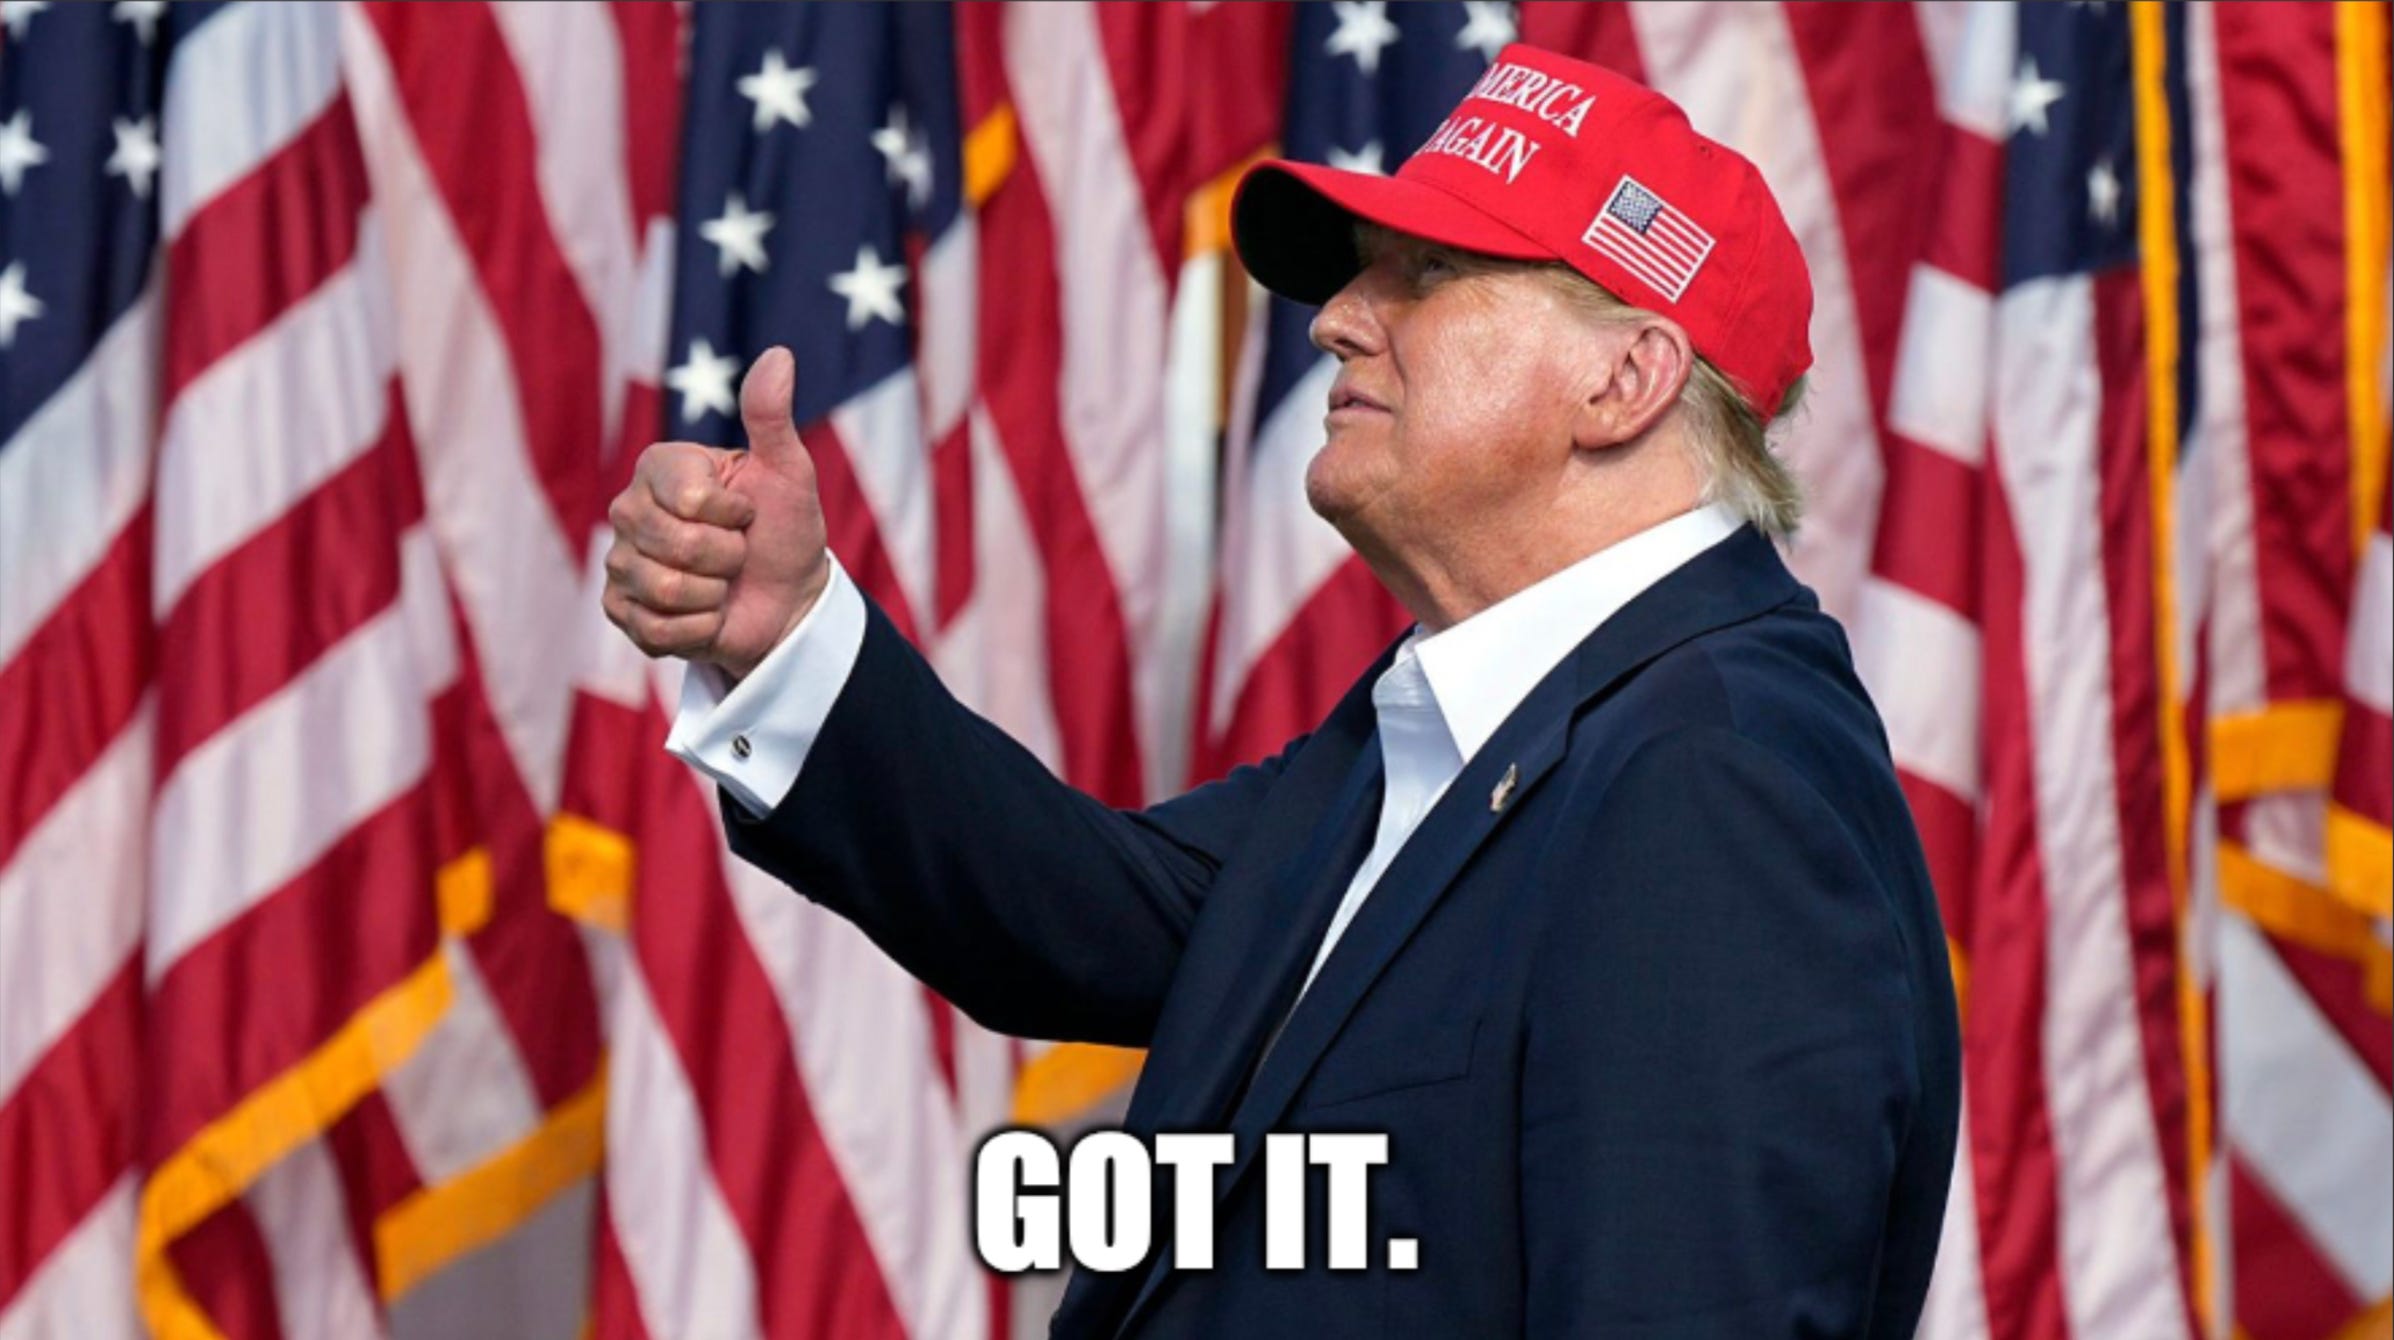
The Trump Trade
Are you surprised to see a ‘Trump Trade’ make the list? Probably not. It’s been a popular topic on the macro scene this week, and it’s quickly made its way to Wall Street, too.
Either Biden steps down or continues his campaign. Either way, the odds of Trump winning are on the rise.
The repositioning of portfolios began at the end of last week following concerns that Biden’s age might impact his ability to serve another term after the contentious debate with Trump. The most significant market reaction occurred in the bond market, with yields on 10-year Treasuries surging by as much as 20 basis points in the days that followed.
The consensus is that Trump’s re-election would spur trades that benefit from an inflationary mix of looser fiscal policy and greater protectionism: a strong dollar, higher US bond yields, and gains in bank, health, and energy stocks. Keep in mind that Republicans are generally viewed as more business-friendly.
Now, to announce the Trump basket comprising of four sectors:
Financials (40%) - SYF, KEY, DFS, COF
Accounts for the prospect of less stringent capital and liquidity rules and easing financial regulation under a second Trump administration.
Energy (30%) - LNG, OXY, XOM
Increased oil and natural gas investment, more drilling activity and higher natural gas exports could benefit producers under Trump 2.0.
Prison Operators (20%) - GEO, CXW
US prison operators are potential beneficiaries of a second Trump administration, on promises of a crackdown on illegal immigration and restrictions on legal immigration by the Republican candidate, which could boost demand for detention centers.
Health Insurers (10%) - HUM
There is a lower risk of drug price cuts and an inclination towards Medicare Advantage in a Republican-dominated government, which could help drugmakers and health insurers.
10% weighting to each name. Got it?
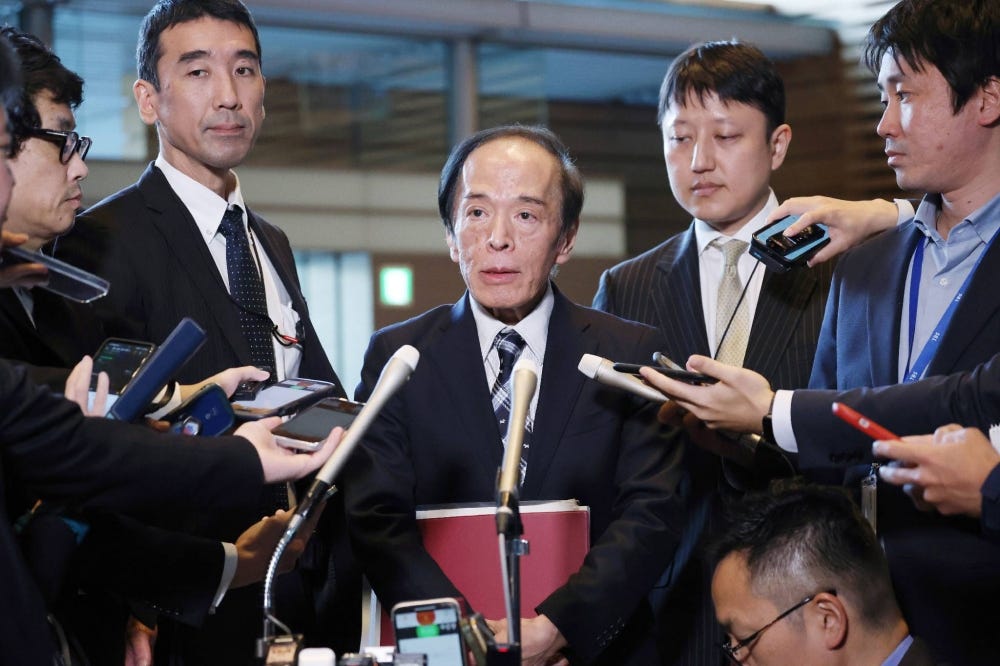
Short JGBs
Before we get onto Japanese Government Bonds (JGBs) specifically, let’s work backwards.
Japan has long struggled to generate inflation, and the details on this are enough for an article in itself. Yet due to this, the country adopted negative interest rates years ago and, as part of the monetary policy toolkit, also implemented yield curve control in the bond market.
Over the past couple of years, low interest rates (as other developed nations started to increase rates to quash inflation) gave rise to Yen’s weakness. Investors could sell (borrow) in Yen at a low cost and buy US dollars to enjoy a high rate.
This has pushed USD/JPY above 161.00, the highest level since the 1980s. To try and ease the pressure, yield curve control has been abandoned, allowing the yields to rise across the JGB curve. However, this has done little to stop the weakness in the Yen, with even direct intervention in H1 only providing a temporary blip in the grind higher.
As a result, we feel that the Bank of Japan will be forced into tightening policy by raising interest rates. We get it — this would further hurt inflation and put pressure on local banks. But it’s one of the few tools still at their disposal to stem the weakness of the Yen.
Ueda, are we right or are we right?
The way we like to express this (slightly contrarian) view is to short JGBs. If yields rise as investors price in more hikes than current, the price of JGBs should fall. In particular, we like the 2-year, which currently has a yield of 0.33% versus the current base rate of 0.1%.
Cybersecurity
Business is booming for both cybercriminals and cybersecurity tech companies. Statista’s market research indicates a projected 69.94% increase in the global annual cost of cybercrime through 2028. As a result, tech vendors are proactively addressing this trend, leading to a promising upsurge in the cybersecurity market in the foreseeable future.
Gartner projects a 14.3% growth in global spending on security and risk management in 2024, outpacing the 8% increase in overall IT spending. Meanwhile, Fortune Business Insights anticipates the cybersecurity market to surge to $424.97 billion by 2030, marking a 2.5-fold rise from its 2023 valuation.
All these facts and figures… what’s the play? Palo Alto Networks (PANW).
The distribution of shareholders in PANW reveals that institutions hold the largest influence, with a 78% stake in the company.
Institutional ownership of securities offers the advantage of being considered as ‘smart money’ due to the expertise and resources at their disposal. Portfolio managers have access to extensive corporate and market data and employ teams of analysts to conduct thorough analyses of investment opportunities. This gives them a significant edge over individual retail investors who lack such extensive resources and expertise.
It doesn’t guarantee that a security will perform well, but it doesn’t hurt to see institutions involved.
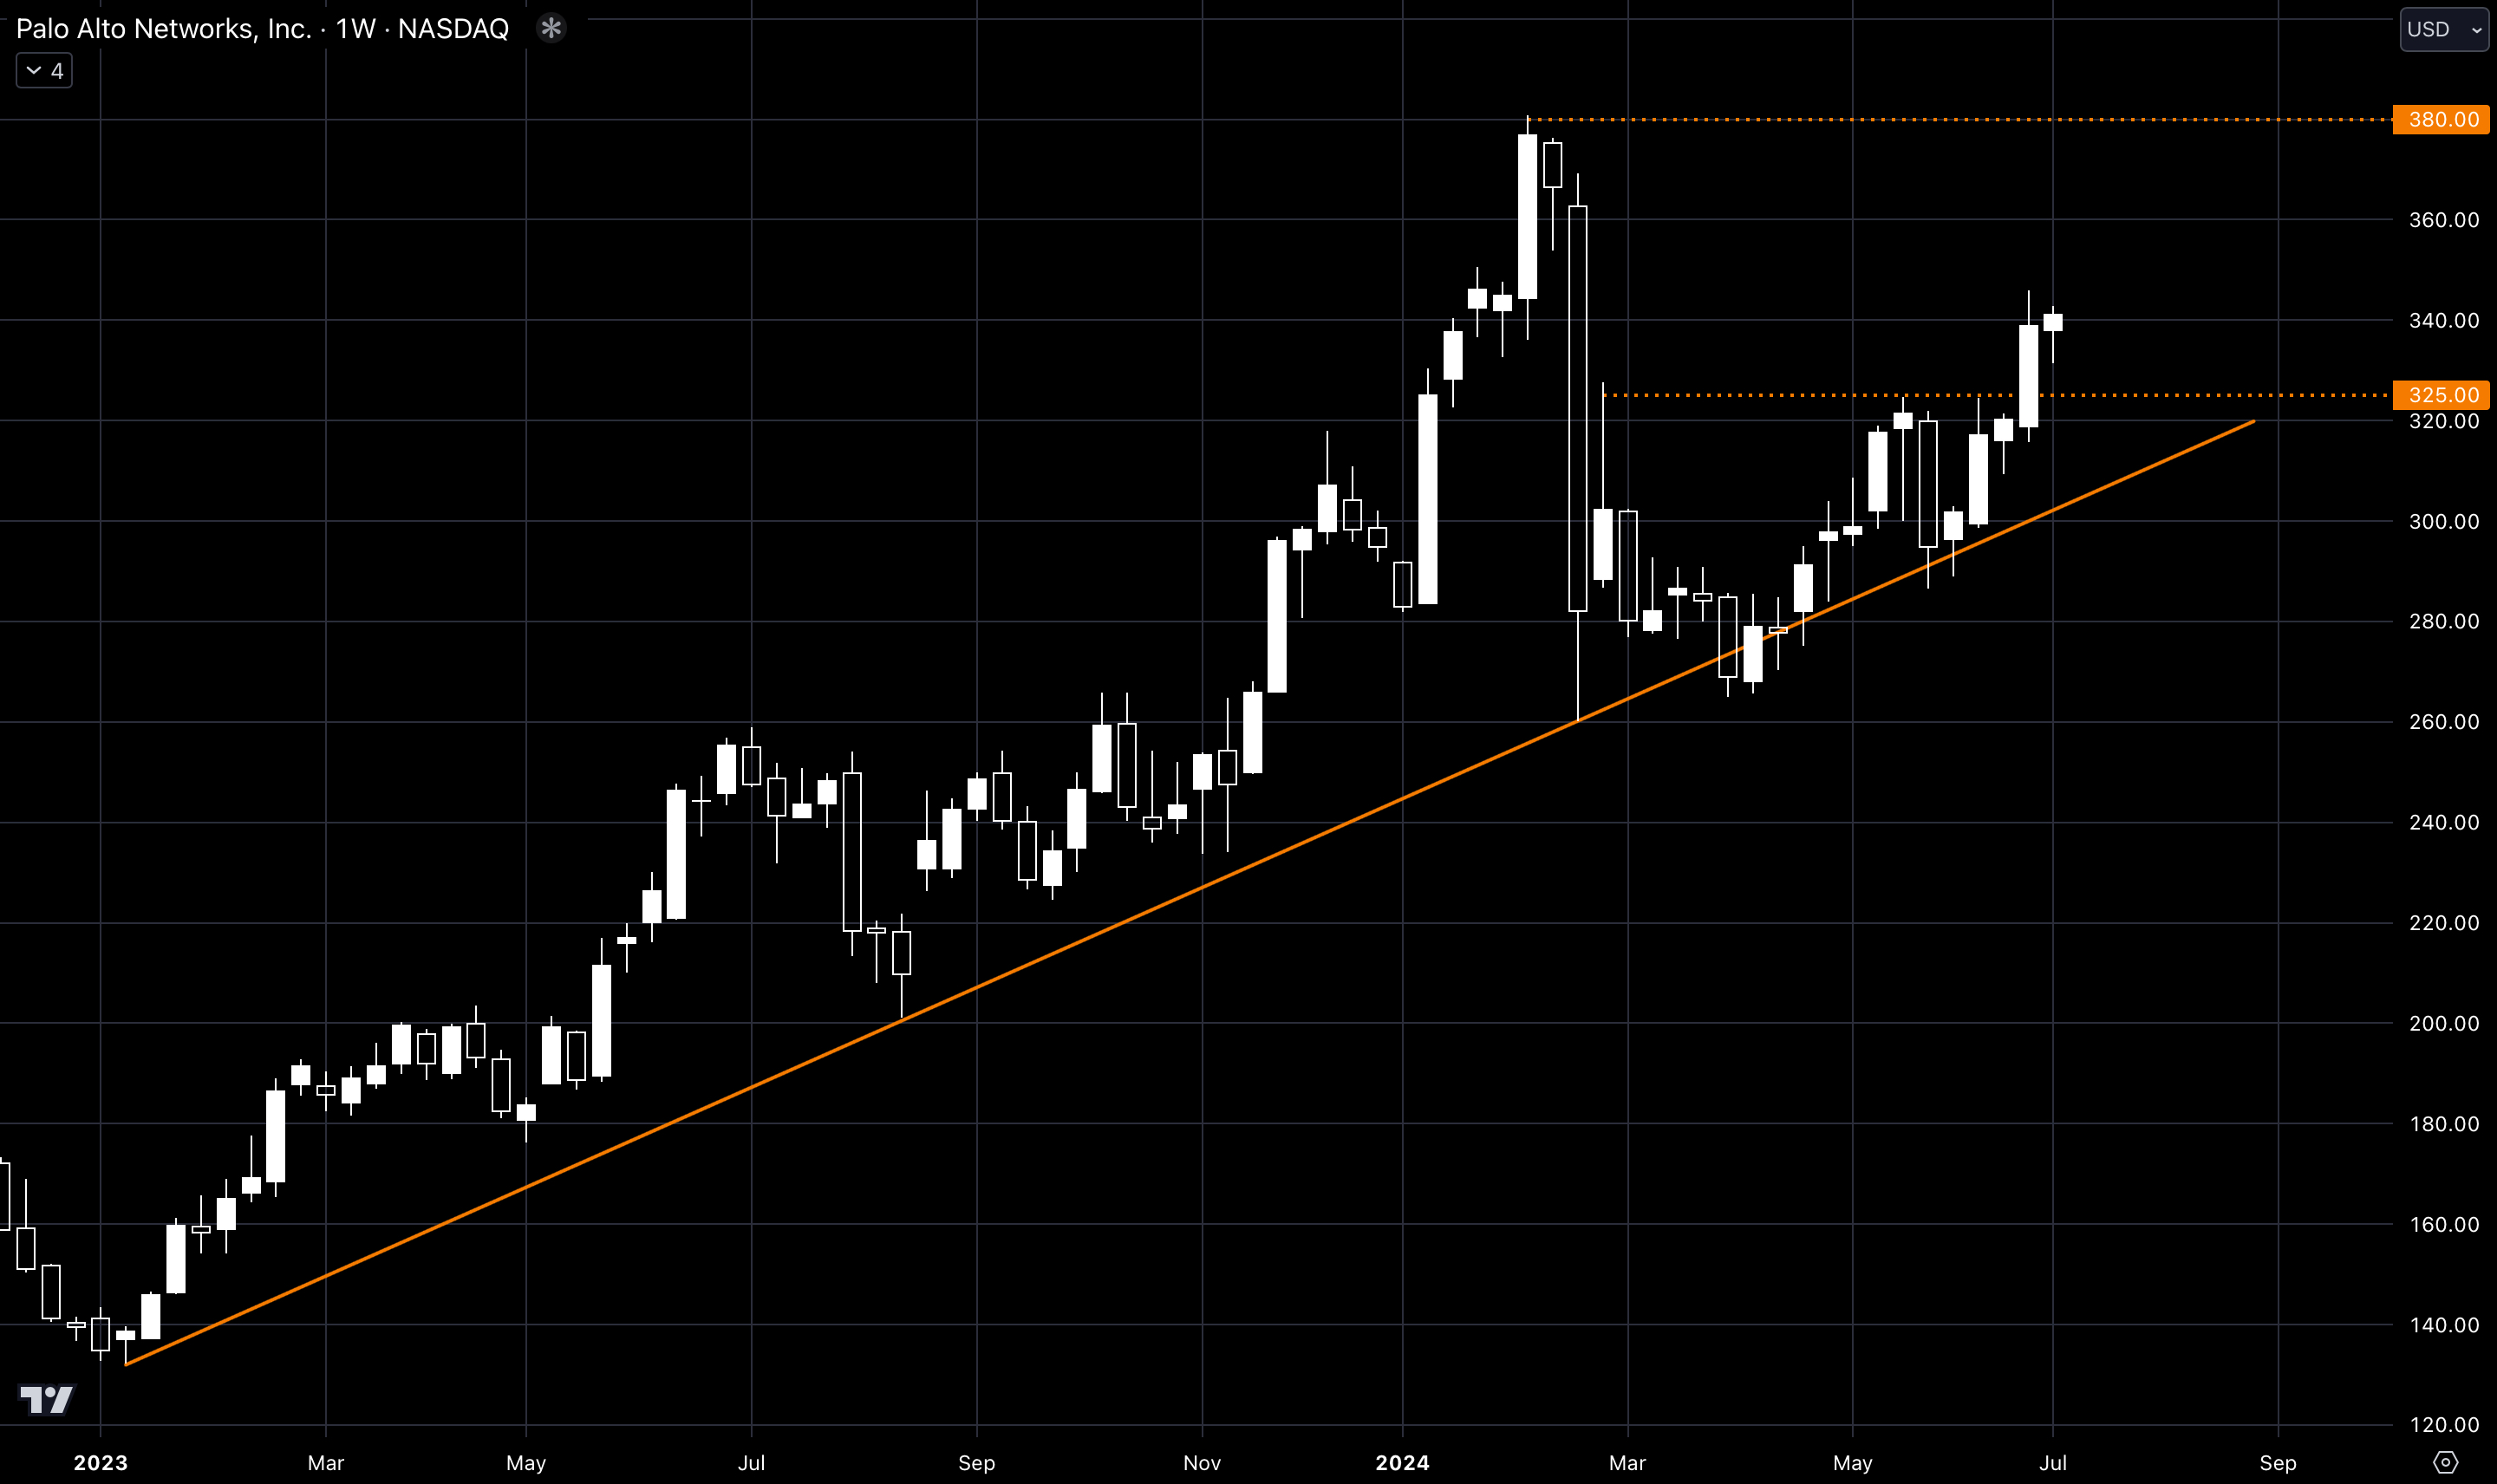
We initially took a position in PANW after the earnings drop in February and added to itThe stock currently towards the end of last month. The stock now holds a 4.5% weight in our portfolio.
We’re interested to know… what are your trade themes for H2?
If you enjoyed the mid-year Mind-storm, please support the publication by liking this post.
Thanks for reading. Trade safe. See you on Sunday.