Markets In 2023 Visualised
A curation of visuals summarising all that happened in equities, commodities, currencies, bonds and the economy throughout the year.
As 2023 draws to an end, stocks are rallying, and bonds are back. Gold is was breaking higher, and Bitcoin is rallying. The economic outlook is more positive than it was when this year started, with markets anticipating rates to come down early next year.
We thought we would recap all that happened this year through some data and visuals, covering equities, commodities, currencies, bonds and the economy.
Let’s start off with…
Equities
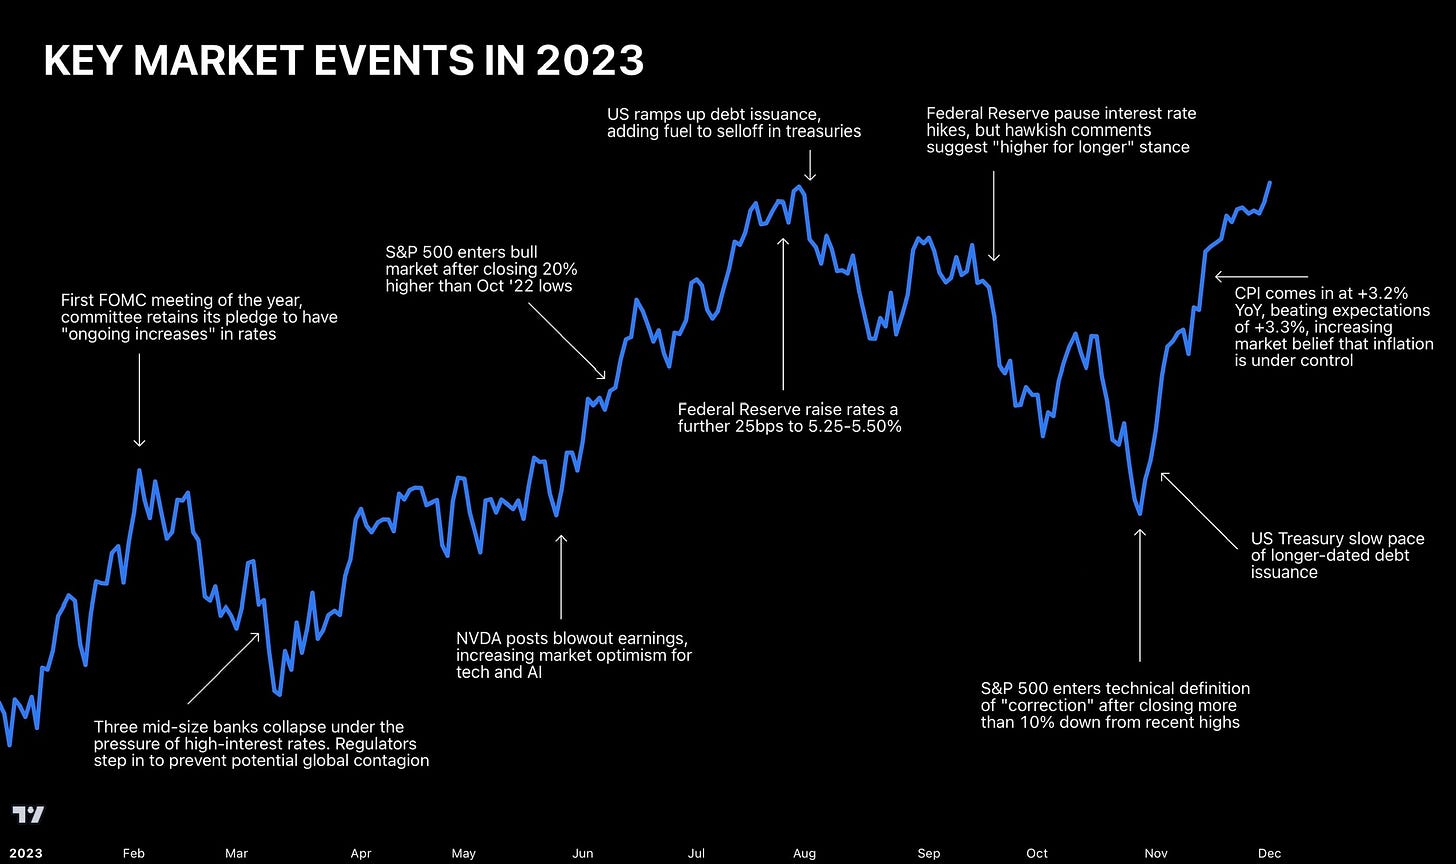
February 1st: The Federal Reserve have its first meeting of the year. The committee retained its pledge to have “ongoing increases” to rates. The following day markets top and pull back the next week.
March 9th: The start of the US Banking Crisis. Over the course of the next five days, three mid-size US banks failed, triggering a sharp decline in global bank stock prices and a swift response by regulators to prevent potential global contagion. Silicon Valley Bank (SVB) failed when a bank run was triggered after it sold its Treasury bond portfolio at a large loss, causing depositor concerns about the bank's liquidity. The bonds had lost significant value as market interest rates rose after the bank had shifted its portfolio to longer-maturity bonds.
May 24th: Nvidia posts blowout earnings, rising 25% overnight. Market optimism about AI increases further, driving tech stocks higher and taking the indices with them. Nvidia never looked back as it continued to rally a further 33% in the year.
June 8th: The S&P 500 closes 20% higher than October 2022 lows, entering - the technical definition of a bull market.
July 26th: The FOMC meeting sees the Federal Reserve raise rates to 5.25%-5.50%, which would end up being the final hike in the interest rate cycle.
August 2nd: The US Treasury boosts the size of its quarterly bond sales for the first time in 2.5 years to help finance a surge in budget deficits so alarming it prompted Fitch Ratings to cut the government’s AAA credit rating the prior day.
September 20th: The Federal Reserve pauses interest rate hikes, but hawkish comments suggest “higher for longer”, and the committee do not rule out further hikes.
October 27th: The S&P 500 enters a technical “correction” after falling more than 10% from summer highs.
November 1st: The US Treasury increased its planned sales of longer-term securities by slightly less than most dealers expected in the quarterly debt-issuance plan, helping spur a rally in bonds amid the possibility a wave of bigger supply will soon come to an end.
November 14th: CPI comes in cooler than expected at 3.2% YoY, boosting market and economic optimism further.
Seasonality
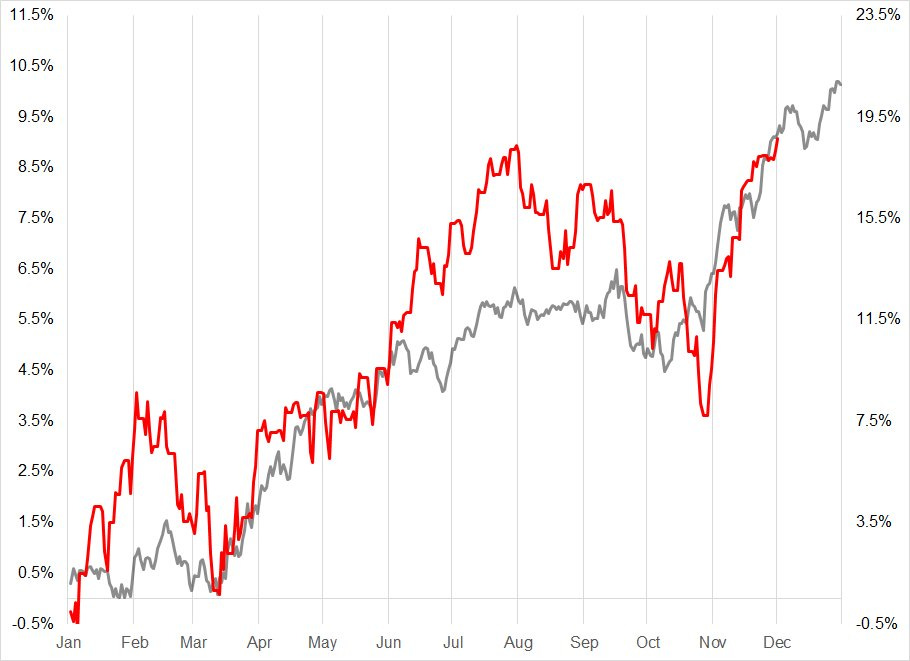
A look back on US equities also shows that seasonality played out again - specifically, the March bottom, the September sell-off and the October bottom.
With a few weeks left in the year and the well-known “Santa Rally”, will markets close at YTD highs?
Sector Fundamentals Looking Ahead
How are corporate metrics looking in 2023?
In the first quarter of 2023, S&P 500 earnings fell almost 4%. It was the second consecutive quarter of declining earnings for the index. Despite slower growth, the S&P 500 is up roughly 12% from lows seen in October.
For health care and utilities sectors, the vast majority of companies in the index are beating revenue estimates in 2023. Over the last 30 years, these defensive sectors have also tended to outperform other sectors during a downturn, along with consumer staples. Investors seek them out due to their strong balance sheets and profitability during market stress.
Cyclical sectors, such as financials and industrials, tend to perform worse. This was seen by the turmoil in the banking system, as bank stocks remained sensitive to interest rate hikes. Making matters worse, the spillover from rising rates may still take time to materialise.
Defensive sectors like health care, staples, and utilities could be less vulnerable to recession risk. Lower correlation to economic cycles, lower rate sensitivity, higher cash buffers, and lower capital expenditures are all key factors that support their resilience.
Fear and Greed
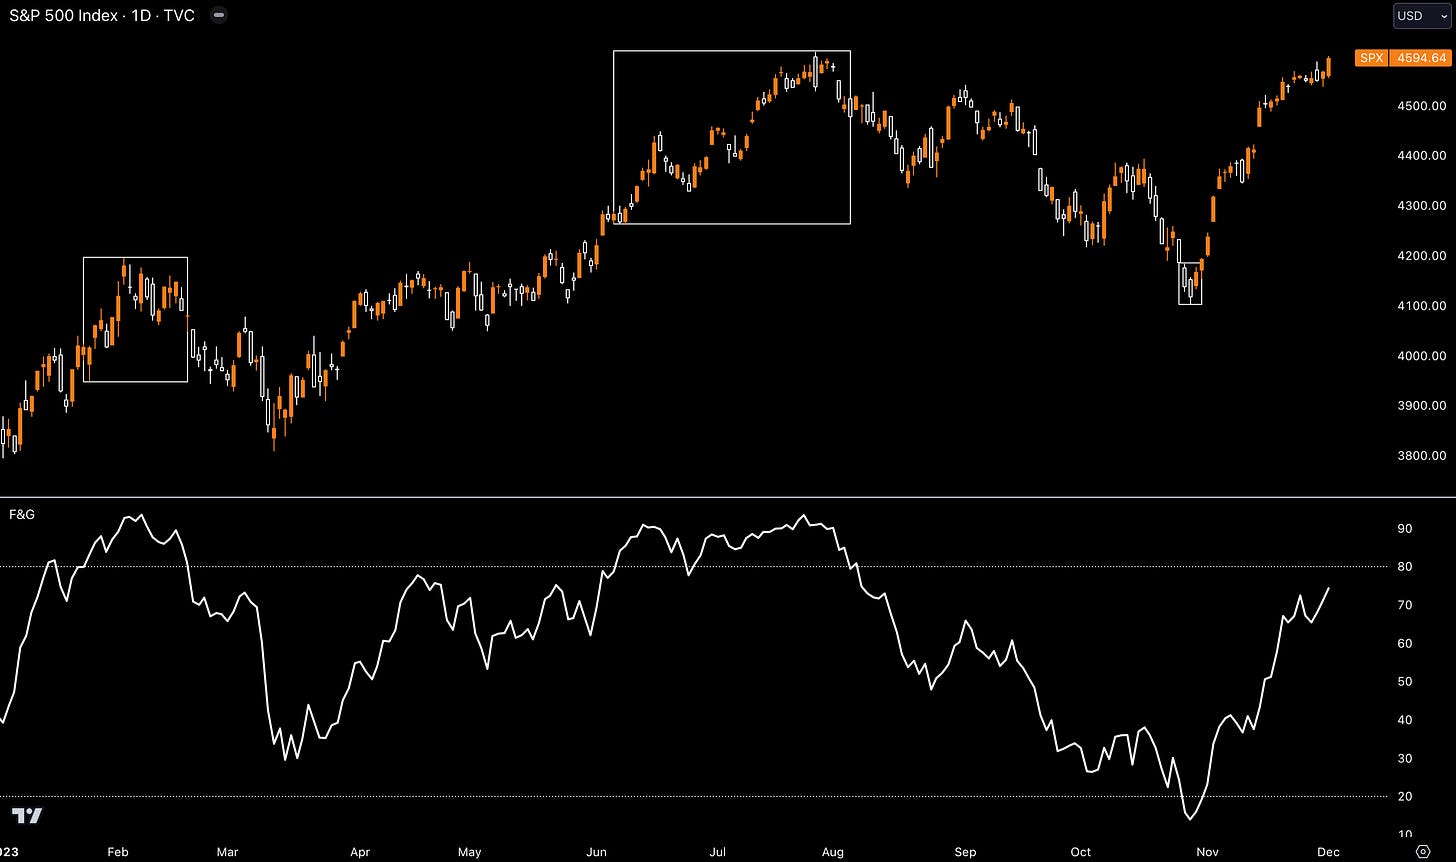
There were not many instances of extreme fear or greed taking place this year in the S&P 500.
Twice the market greed index went above 80, which did create swing highs in February and July. However, these tops took a while to play out, with extreme greed staying around for several weeks on both occasions.
Extreme fear was the opposite. Only once did the gauge drop below 20, and markets spent no time waiting in this zone. Positive news from Treasury issuance saw markets quickly recover. And they haven’t been stopped (so far) in Q4.
Sentiment Check
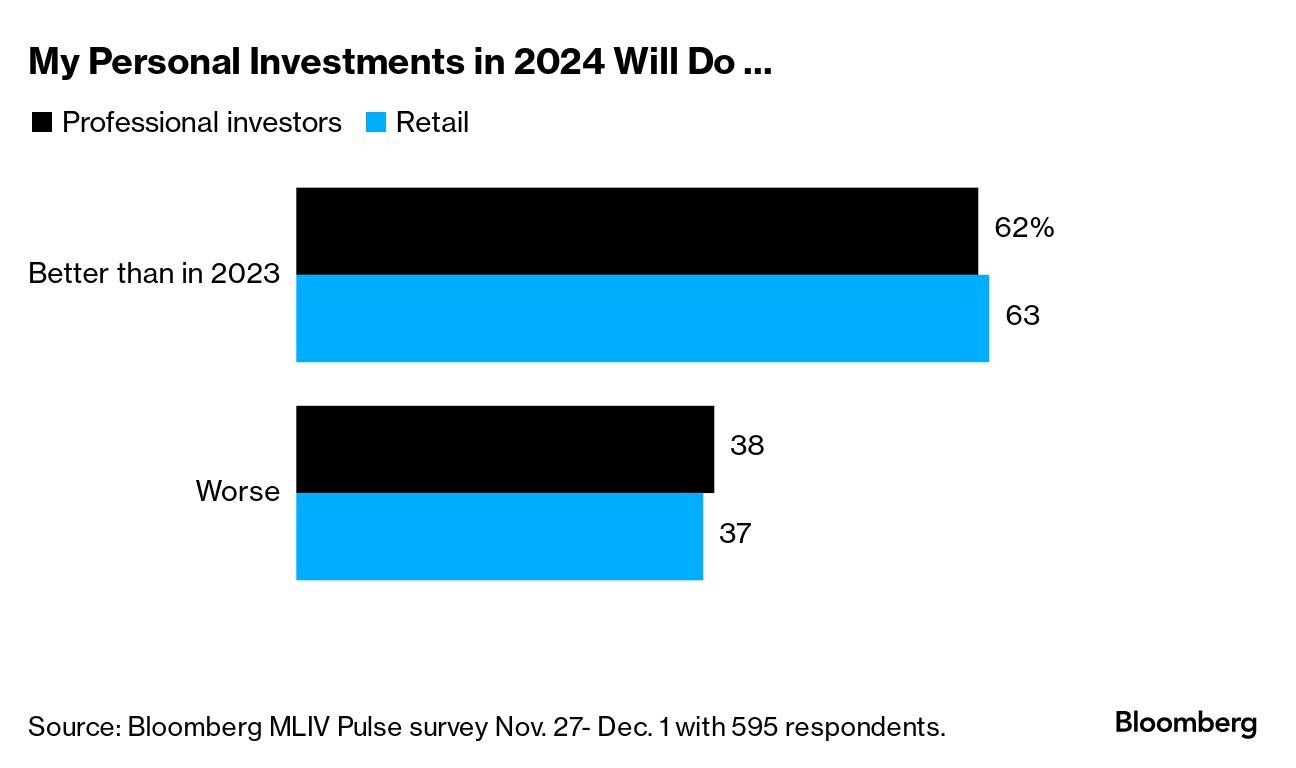
Safe to say, the current stock market greed is having its effect on the MLIV Pulse survey.
2023 provided some excellent stock returns, returns that definitely were not expected as the year got underway. The S&P 500 is up 20%. Nasdaq 100: 46%. Nvidia rose an incredible 220%. But investors still believe 2024 will be better. Either they think there will be similar returns, or they will actually catch the moves next year (because who could’ve known Nvidia would jump 25% off those earnings in May).
That optimism hinges on the assumption that the Federal Reserve will cut interest rates, fueling rallies in stock and bond markets.
Commodities
Commodities saw plenty of swings this year. Oil faced plenty of supply and demand issues, as well as geopolitical factors playing a part. OPEC cuts in July led to a major rally. But a sceptical market quickly took hold as prices swiftly declined. War in Gaza and further OPEC cuts have failed to sustain higher prices.
Gold has benefitted from a falling dollar. Lower interest rates reduce the opportunity cost of holding zero-yield gold, and the benchmark 10Y Treasury yields slipped to a 12-week low, both helping boost the bullion in recent days.
September through to date has seen an interesting dynamic amongst all the commodities. Oil rallied, and metals fell. Then, all reversed in October.
In the rest of the article, we’ve curated several bond, currency and economic visuals to share with you. These can be accessed by joining ‘AlphaPicks on Wall Street’ as a premium member. A monthly subscription is just £5 (€6 or $7).
In fact, we have an abundance of new features that we will be bringing to our page very soon. Stay tuned for those announcements.
If you want to read more about our current outlook for 2024, you can find a link for that article here:
Annual Outlook 2024
Over the course of the past six weeks, we’ve been busy writing up our key views on the main asset classes for 2024. We dropped the Outlook over on X on Friday. You can read the full 26-page version by clicking here. But what if you don’t have the time to read it all and just want a clean summary of some of our key views? Don’t worry, we’ve got you…
Please feel free to share any of the above or below visuals on social media. We kindly ask that you mention us in your post.
Onto the rest…


