

Sifting Through the Noise
Introducing the Macro Monitor.

As Q2 draws to a close, it’s pretty wild to consider that it was only at the start of the quarter when markets were thrown into turmoil via the “Liberation Day” tariff announcements.
The ramifications of the policy shift were felt across all asset classes, with subsequent negotiations and a spat with China dominating headlines. As we moved through the quarter, central bank action started to attract investor attention, with the global war on inflation clearly not over.
The continuation of themes in the equity space, such as AI and defence, combined with a steepening of the US Treasury curve and JGB liquidity concerns, along with record highs for gold, meant that participants needed a high-level macro view to monitor the situation effectively.
All of that before we can even begin to talk about the conflict in the Middle East…
As we come up for air (briefly), we wanted to visualise some of the most important charts right now, which coincide with many of them being part of our new Macro Monitor that more formally launches next week.
The Macro Monitor is designed to provide a high-level visual depiction of key asset price movements, ranging from US Treasury spreads to US investment grade CDS pricing, from EUR/USD implied volatility to SOFR calendar spread movements.
Paid subscribers can access the monitor and request specific elements to be added to it in the future.
Join now before prices go up on Monday.
Rates Show Central Bank Divergence
Focus has been on Dec-25 / Dec-26 rate futures spreads, also known as Z5Z6 contracts. For the US (SFR), the EU (ER) and UK (SFI), Q2 has seen the beginning of a divergence in expectations for the year ahead.
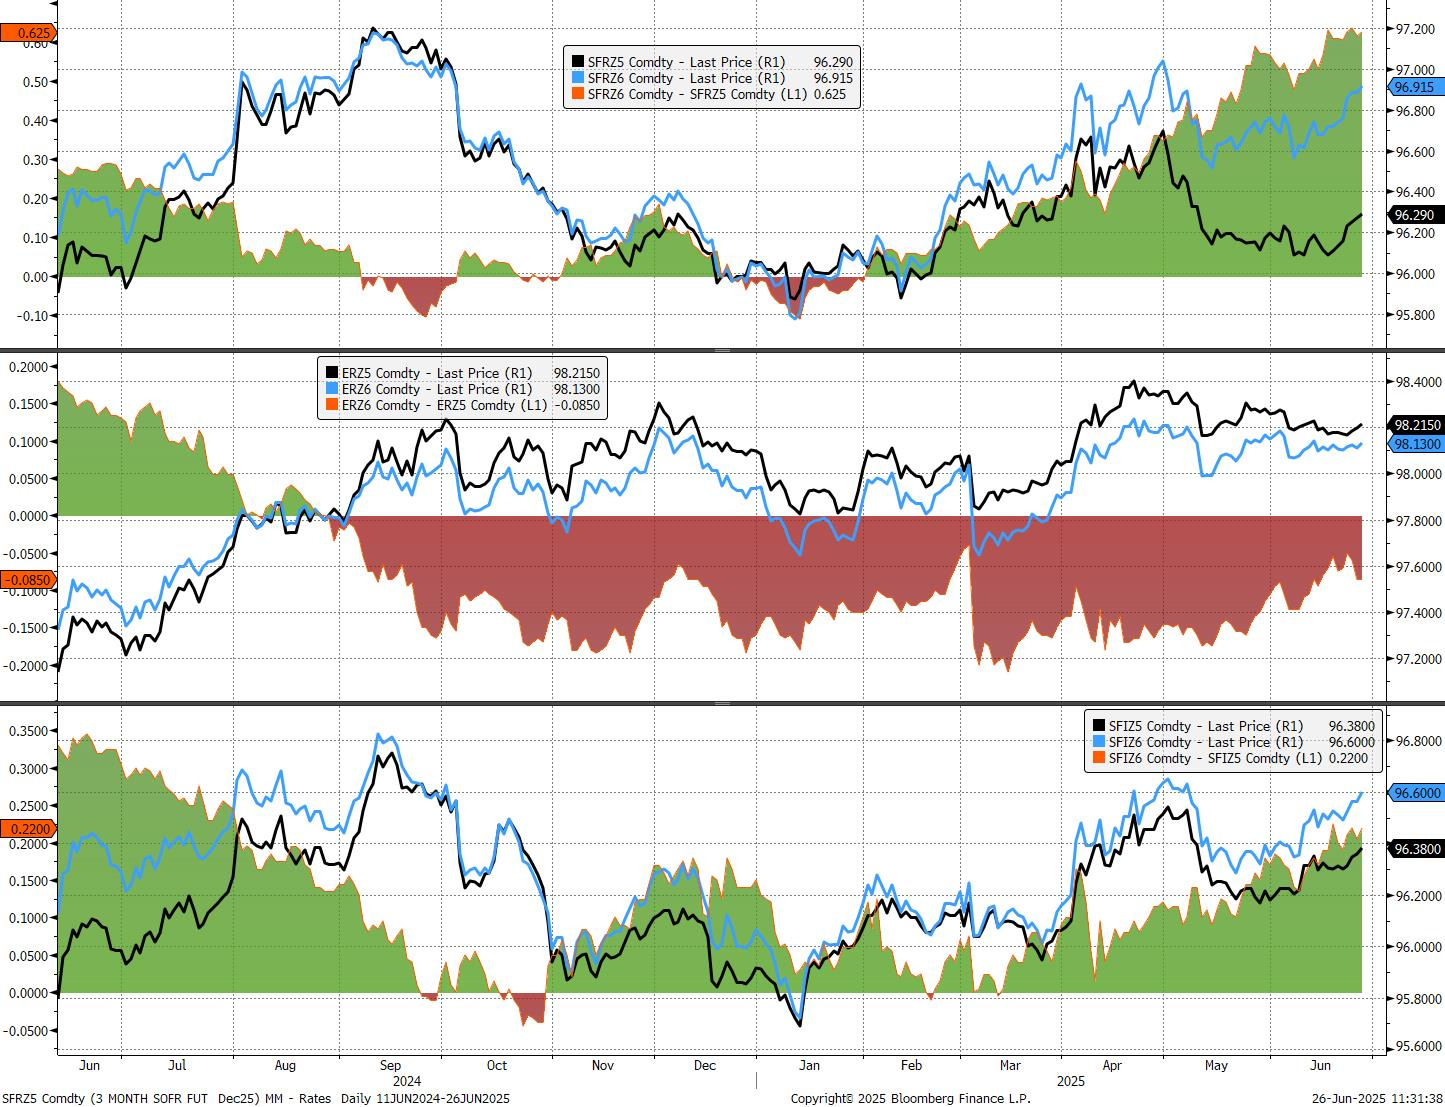
The US and UK are more in lockstep, with the Z5Z6 spread widening as more rate cuts get pushed to 2026 (the so-called “deferred rate cuts” trade). This has mainly come in response to central bank commentary, with Powell and Co in a cautious mode, trying to see what impact inflation tariffs will have. In the UK, the Bank of England (BoE) is sticking to its forecasts of a rebound in inflation later this year, creating a juxtaposition between managing the price level and trying to stimulate a weak labour market and a stalled economy. This has translated to a move higher in bot SFIZ5 and SFIZ6, but still has a widening bias on the Z5Z6 spread.
It has been a different story for the Eurozone, where further consecutive rate cuts put the base rate at 2%, with only one additional rate cut now priced through to the end of this year according to current ERZ5 prices. Z5 pricing is actually above Z6, indicating that we could see the end of the easing cycle from the ECB within the next 12 months.
Although we don’t expect any rate hikes in 2026, it’s a clear divergence from the US and UK.
Steepening Bias for Treasuries
We entered Q2 with a sharp move higher in the UST 2s30s. Yet, as the below visual shows, the movements in the past couple of months have been driven by different elements.
To interpret the chart, each bar is colour-coded to reflect the nature of the daily move in the yield curve. These moves are categorised as either a steepener or flattener, and further distinguished by whether they occurred in a bull or bear market environment.
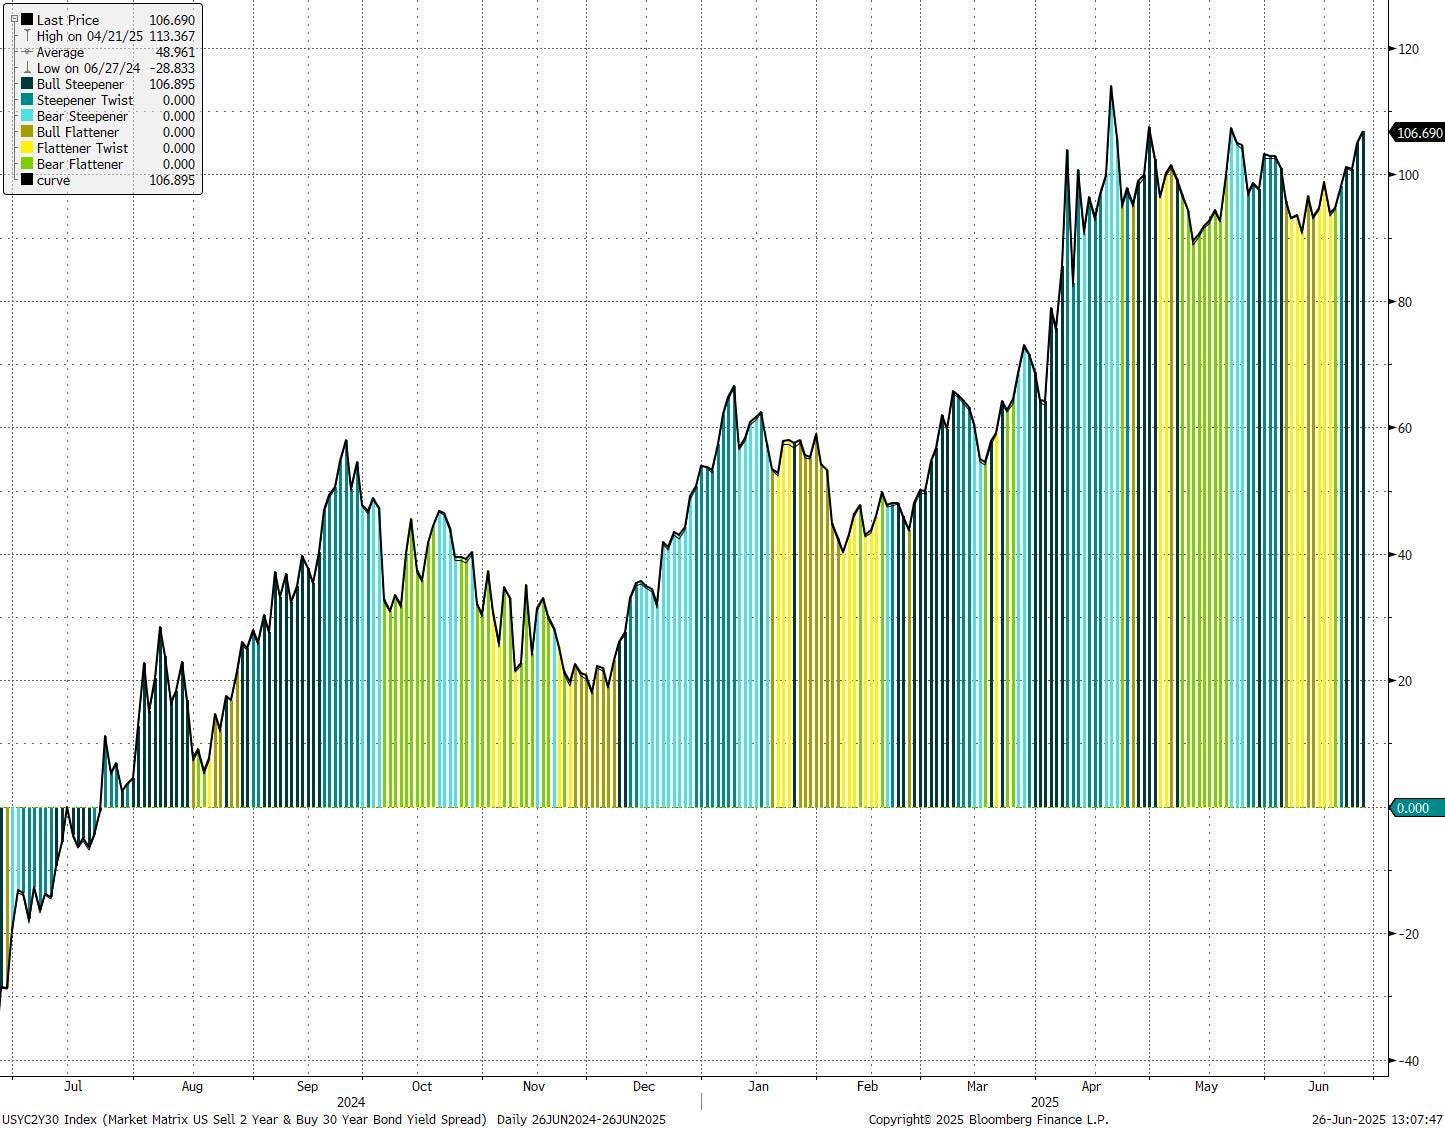
A bull steepener (light blue) indicates that yields fell overall, with short-term yields falling more than long-term ones, typically reflecting expectations for rate cuts.
A bear steepener (dark blue) means yields rose, particularly at the long end, suggesting rising inflation or supply concerns.
A bull flattener (yellow) reflects falling yields, with long-term rates declining more than short-term ones, while a bear flattener (green) shows rising yields, led by the short end, often due to hawkish monetary policy signals.
May was characterised in a large part by bear flattening (green) following the Fed meeting where rates were kept on hold and the statement highlighted persistent inflation—especially in goods due to tariff pressures—as a key reason to avoid premature cuts.
More recently, in June, we saw the emergence of a period whereby markets priced lower short-term yields as well as lower longer-dated tenor yields (the 30-year). There was better buying in the long end as concerns around US fiscal stability eased somewhat, with weaker economic data sending the short-end lower.
VIX Lower As SPX Pushes Higher
Part of the volatility component of our macro monitor focuses on the VIX index relative to the S&P 500 (the second of the two charts shown below):
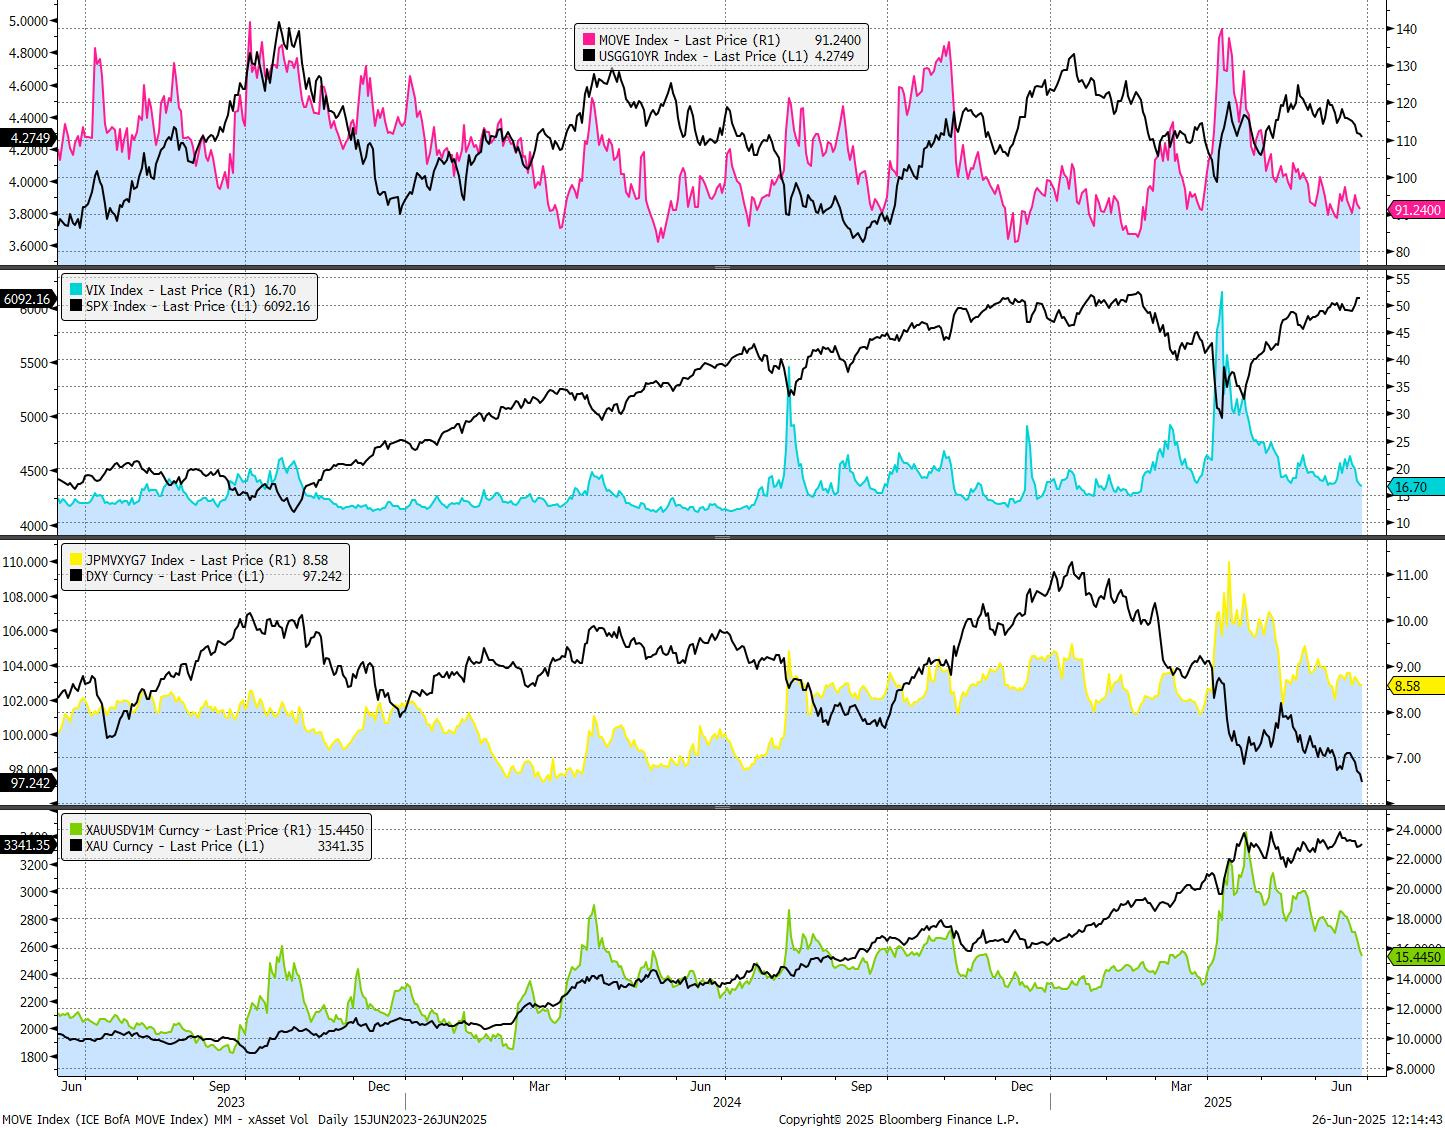
The sharp drop in the equity markets and spike in the VIX coincided (no surprise) with Trump’s tariff announcements, and the subsequent rally back in SPX (to test new record highs) has been matched by a remarkable decline in implied volatility.