The Contrarian Gold Trade
Although in reach of an all-time high, we have a different view of Gold.
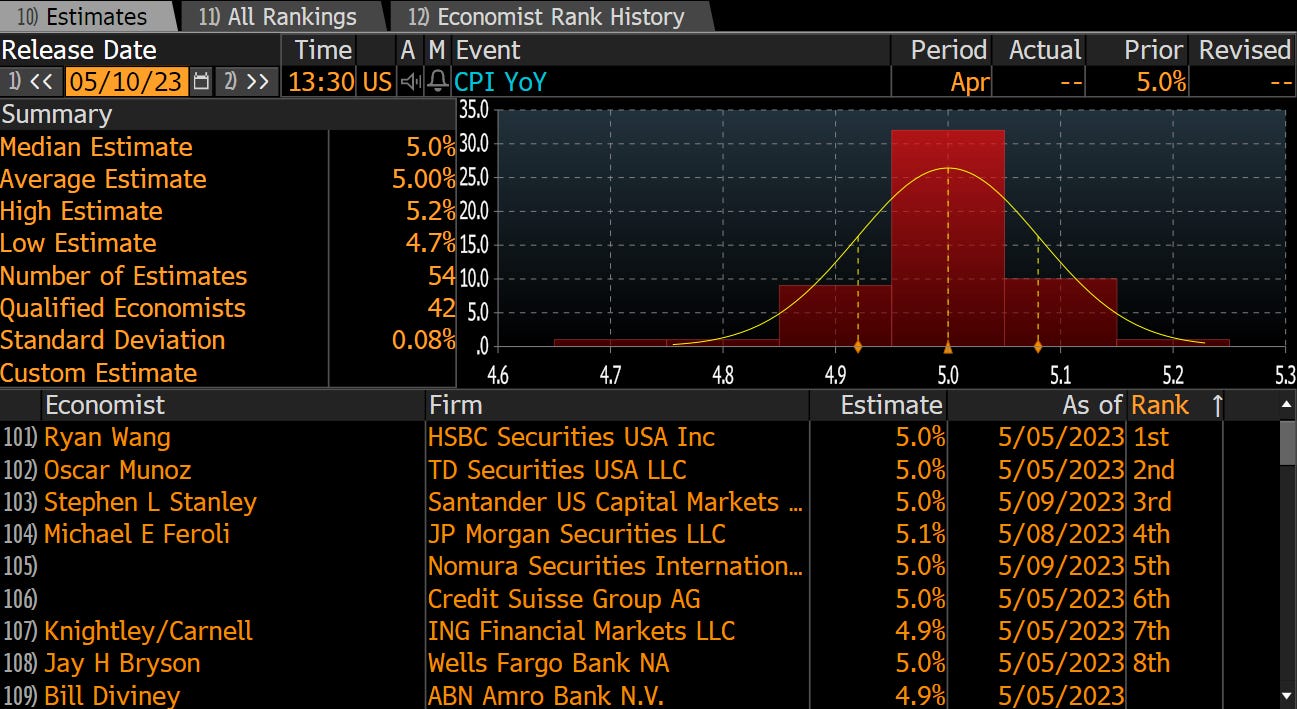
Before the US equities open today, we see the release of the latest CPI data (8:30 EST and 13:30 BST).
Investors are focusing on the data that will influence the Federal Reserve as it mulls when to pause its monetary tightening cycle. Figures are expected to show that headline inflation in the US rose by 5% in April on a year-on-year basis, a level likely to still be uncomfortably high for the Fed.
A hotter-than-expected inflation report would justify “higher for longer” and would likely see equities sell-off. This could also boost demand for the safe-haven asset, gold.
Although today’s report (estimates below) could see a boost in the asset’s price, we have a slightly different view of gold over the next three months.
Firstly, the correlations
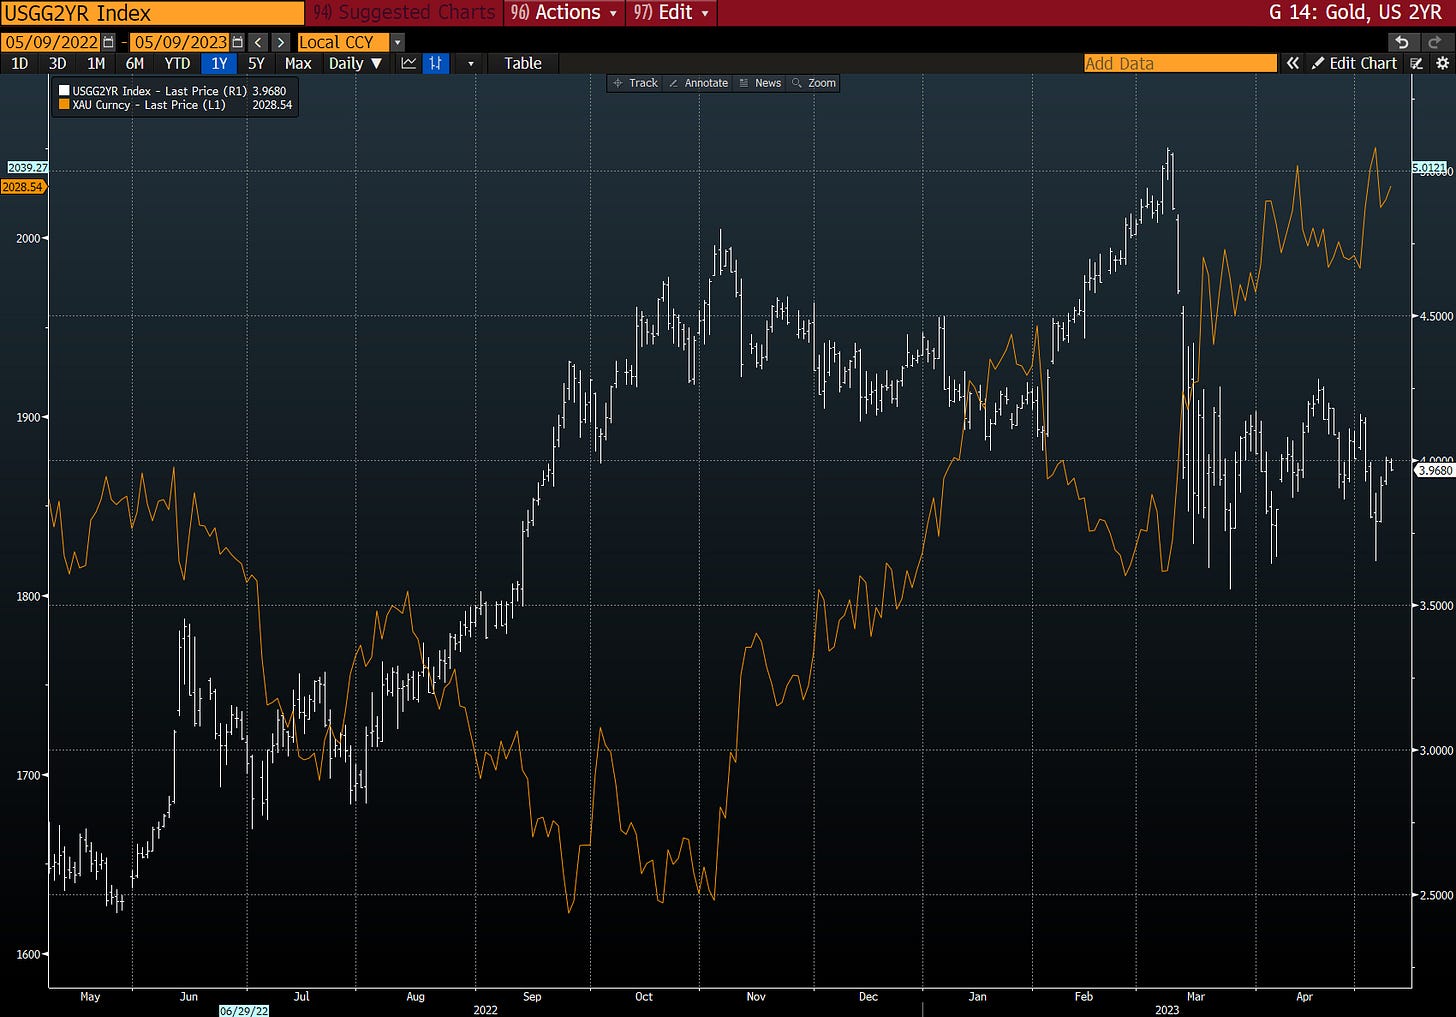
Gold vs US 2yr Yield - Over the past year, we've seen the return of a strong inverse correlation. With gold being a non-interest-bearing asset, the opportunity cost of holding gold increases when yields rise.
Yet with the fall in yields over the past month, we feel the 4% level is fairly priced. So on that basis, we see little room for gold to move higher/lower based solely on yields materially.
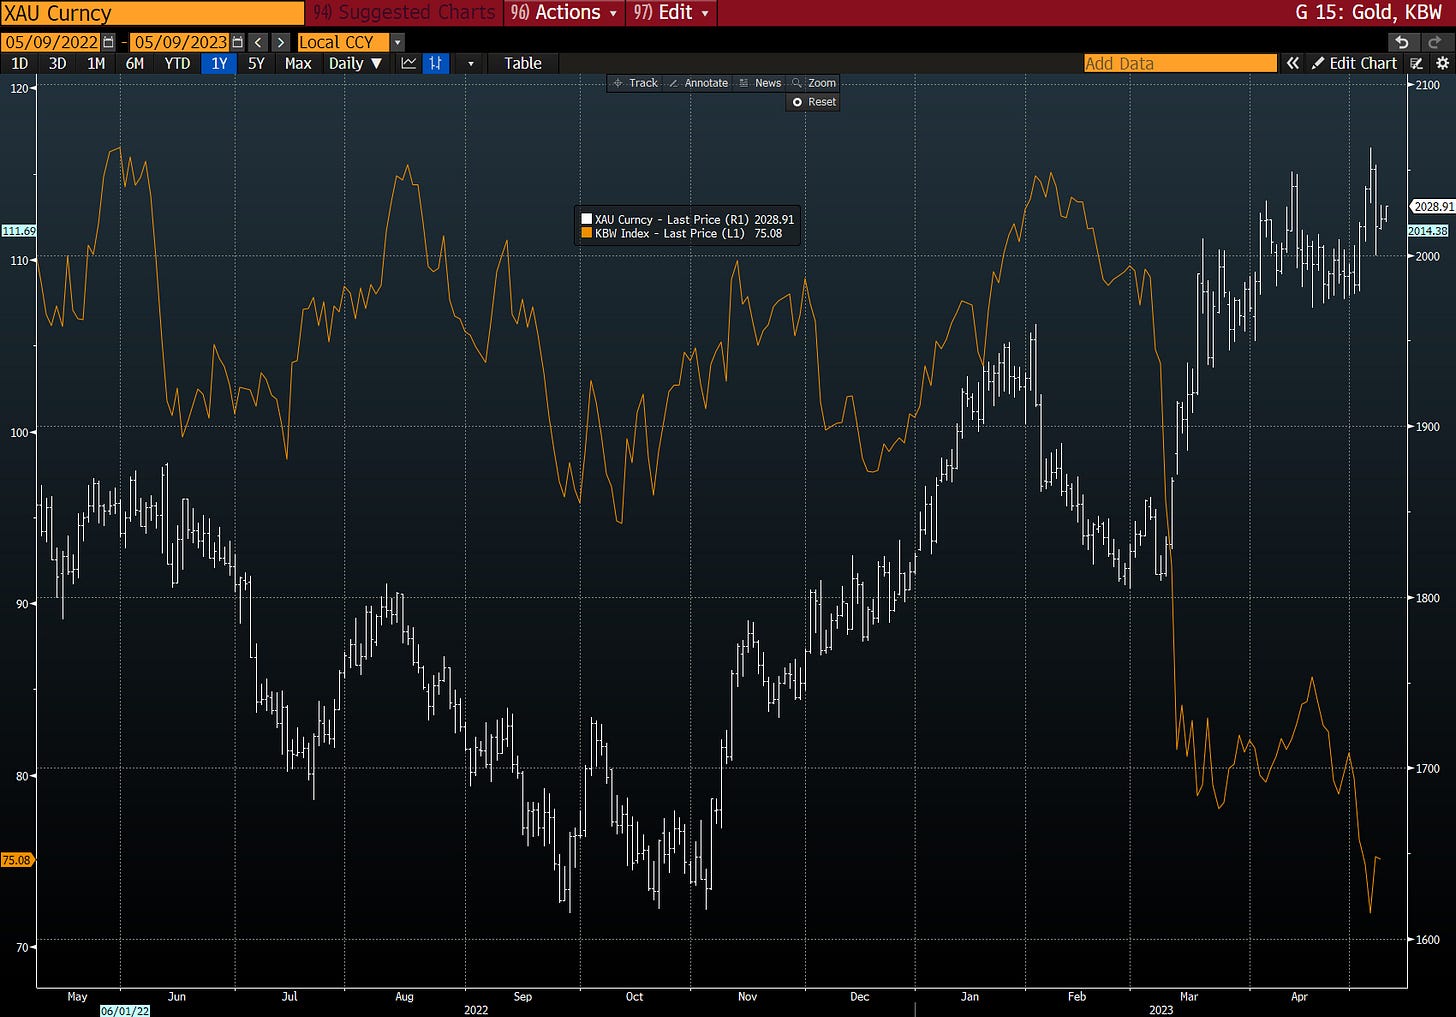
Gold vs KBW index - The KBW index broadly measures US banking stocks. As noted from the meltdown earlier this year, investors flocked to gold as a haven during this sell-off. Moreover, US banking failures have continued since then, supporting gold further.
However, the financial instability is having diminishing returns on gold, as investors either become less concerned or have already hedged. This makes us believe that further instability is unlikely to provide a material boost for the gold price.
2008-09
You might yawn at the mention of another 2008 comparison. We know our timelines have been filled over the past year of price action charts showing 2008 over the 2022 equity markets.
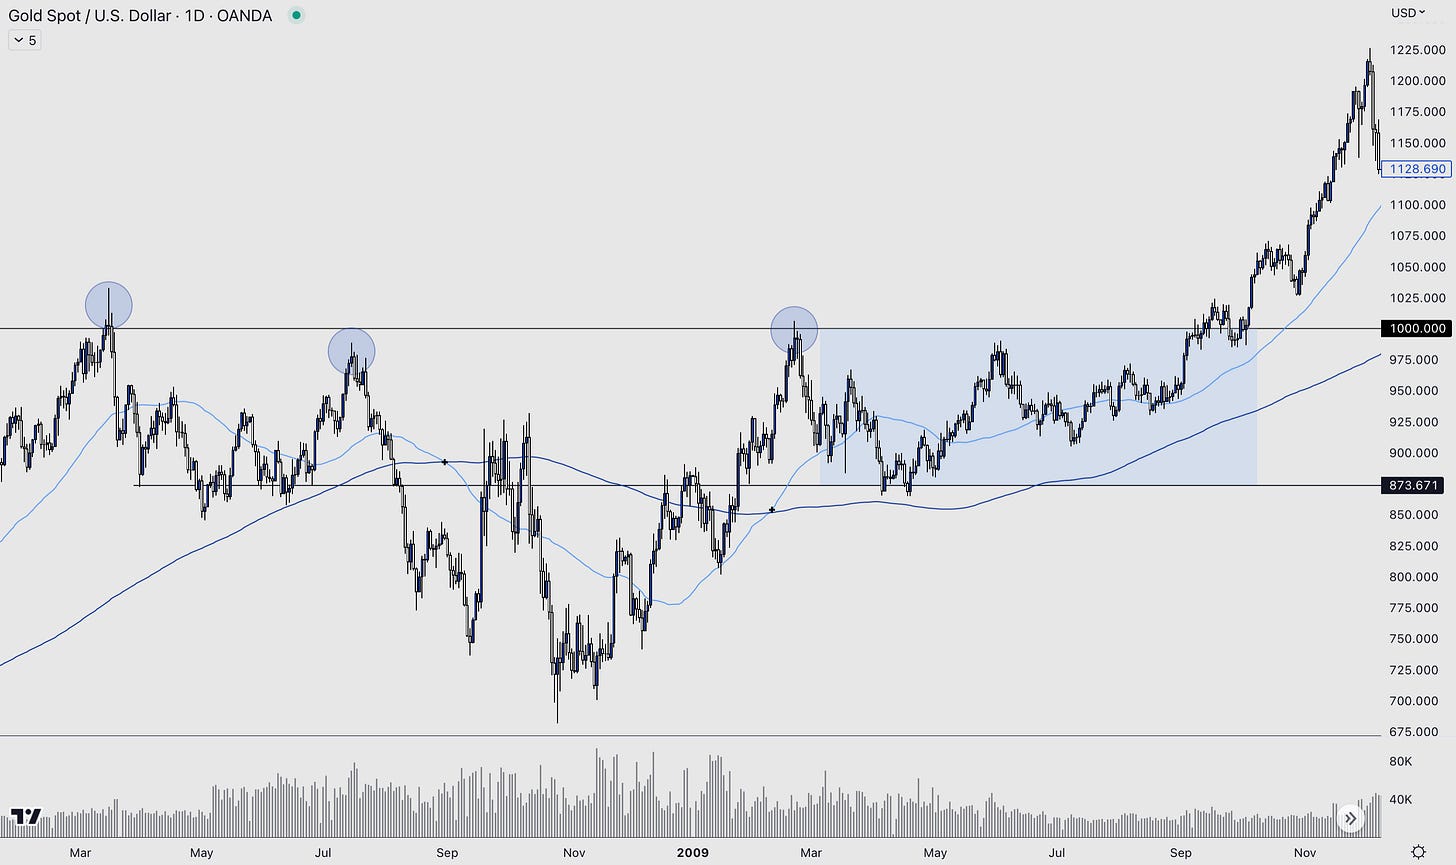
But don’t worry; this is a different comparison for you. We have looked into the gold price action over previous years and found a similar situation.
The first test of $1,000 for gold/oz led to a rejection, followed by several months of retests. Finally, price consolidated between 870-1,000 and broke higher, leading to a 20% move. See below the daily chart from ‘08-‘09.
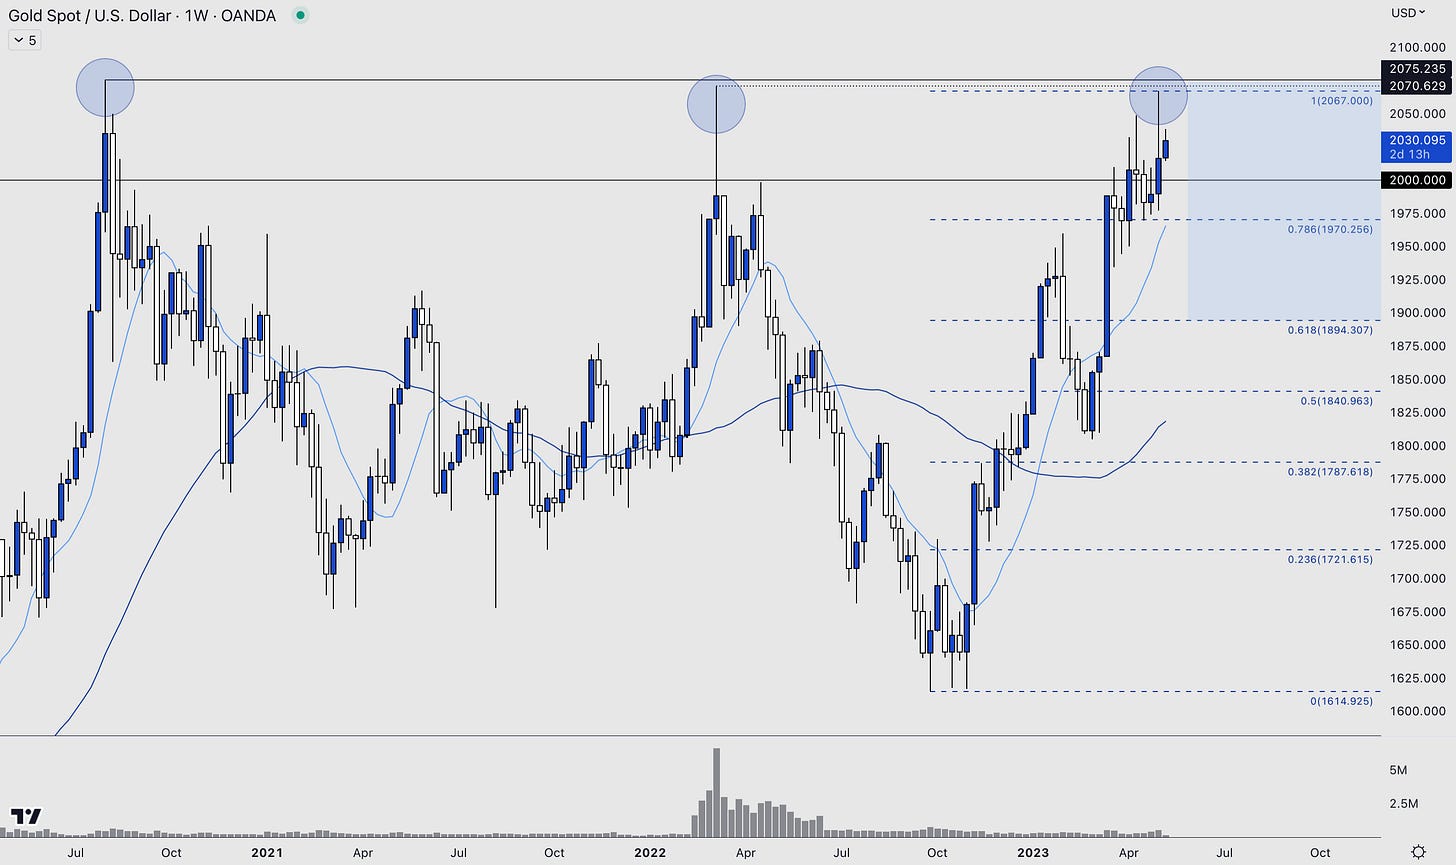
The following chart is the gold weekly after it first hit $2,000 in August 2020 to the current day.
This current setup has happened over a much bigger timeframe than the previous chart. For example, the three tests of $2,000 have occurred over 34 months, compared to those of $1,000 over just 12 months.
As mentioned in the comparisons to the 2yr Yields and the KBW Index, a time for consolidation is likely.
The price may consolidate between ~$1,900 (the 0.618 Fibonacci retracement) and highs of $2,070 before breaking higher.
It would be healthy for a move higher for gold to spend some time trading just above $2,000. The chart shows that the last two weekly attempts above this have seen sellers take control. But sellers are showing more weakness this time as gold hovers around the key level.
How we are playing the thesis
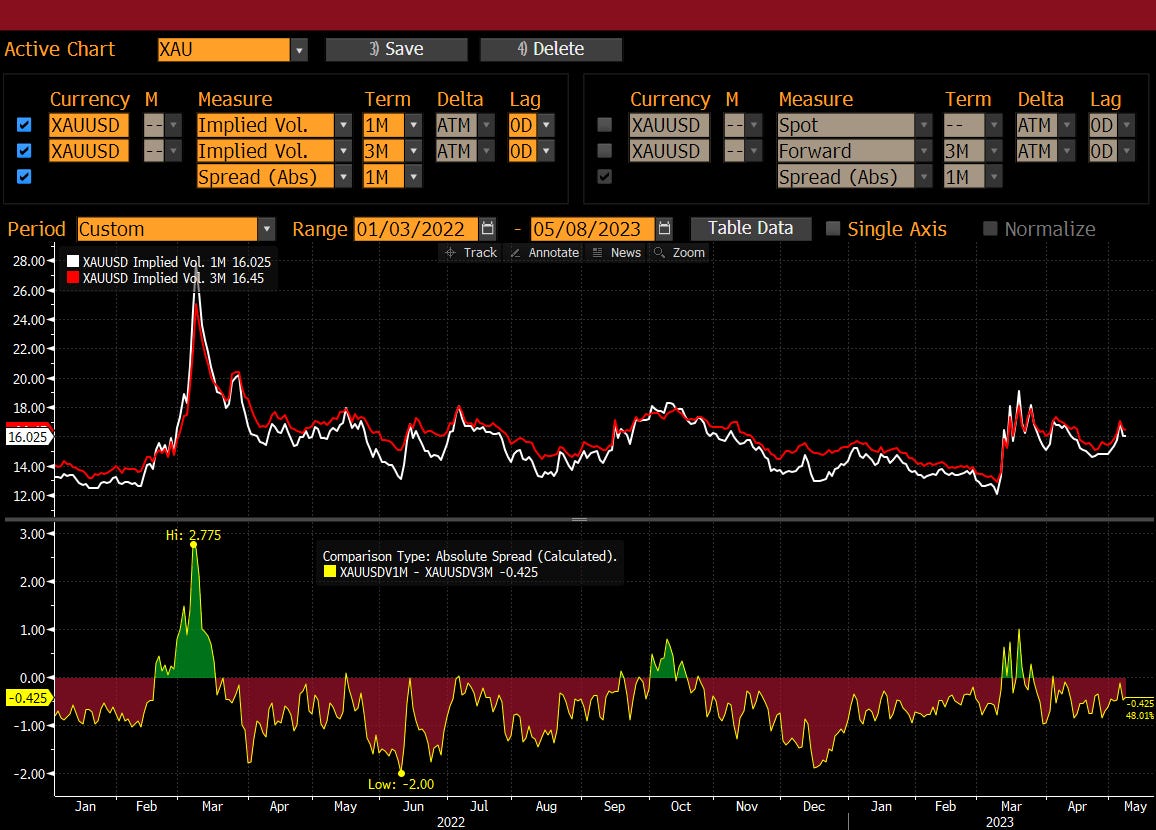
3-month and 1-month vols hit fresh year highs in March and remain elevated. These are two more factors that make us believe gold is likely to remain rangebound in the coming months.
If this is the case, volatility should fall. We like to try and profit from this by options ideas that stand to gain should this be correct. It also allows us to take a non-directional view of gold moving higher/lower.
Our idea: Condor.
3-month expiry: sell 2150 call, buy 2300 call, sell 1900 put, buy 1750 put. Receive a 1.45% premium.
But longer-term…
This is a reminder that this view and trade we are playing is for a slightly shorter time frame, ~3 months.
Longer-term, we are bullish on gold and the protection it offers, and we think, after a period of consolidation, the price is set to start a new chapter, perhaps near $2,500.
AlphaPicks is a reader-supported publication. We value all of our readers and cannot wait to continue to bring more insights in the future and continue to expand our work.
We saw an interesting quote in the Financial Times this week: “Pretty much all media and information services are subject to an economic paradox — you only want to consume the good if it’s high quality, but you can’t tell what quality it is until you’ve consumed it.”
We agree. Although 80% of our work is free for all to read, we have some content for our paid readers. Contemplating the paradox above, we would love to offer any of our free readers a 7-day trial of our premium content because you only know the quality once you’ve consumed it.
This premium content includes trade ideas and what we are watching ahead of each week, and trade ideas for each topic we write about in an article, such as the gold one above (although we have kept this trade idea free for all).
Please consider signing up for seven days to see if you find value in our offer.


Well I have consumed and like the flavour :-) True statement though... one can always "taste and see" the benefits, what is there to loose. As you said in your opening once, it is a price of a cup of coffee :-)