This Historically Happens After The NASDAQ Jumps 8 Weeks Straight…
History might not repeat itself, but it rhymes.
Historical data shows a short-term correction might be unlikely in the coming weeks.
With an average annual gain of 82.65% post-rally, the NASDAQ could be set for a strong rest of 2023.
Risks to this view include a US recession and sticky Core PCE inflation.
Last week, the broad US stock market rally hung in the balance ahead of the US Fed meeting. Despite the meeting being described as a ‘hawkish pause’, traders simply didn’t believe Powell’s press conference of trying to sound overly hawkish to the market.
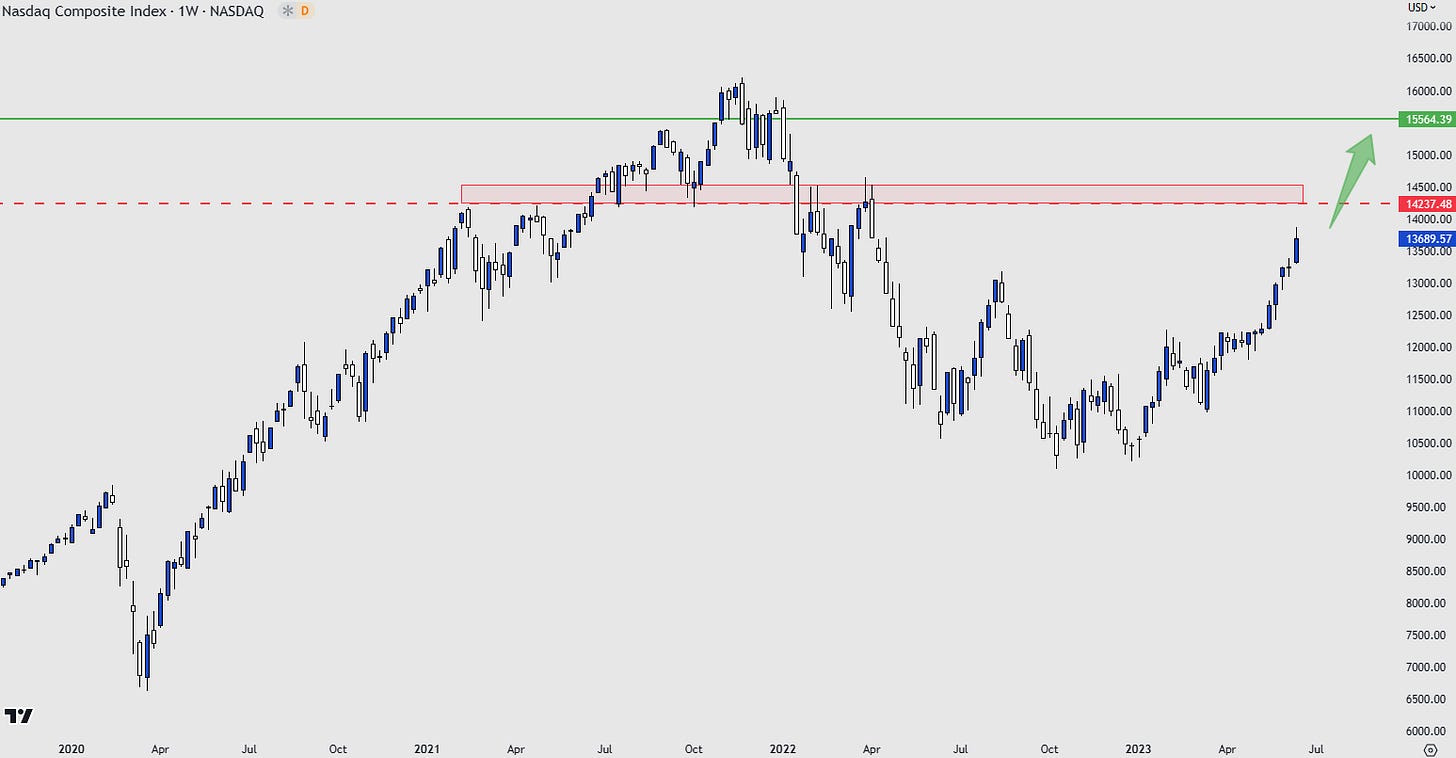
This ultimately meant that the NASDAQ Composite was able to close Wednesday in the green and could push higher to close the week out. This was significant because on close on Friday, it marked the eighth consecutive week of gains for the index. The run is shown on the chart below:
While bulls and bears are still at loggerheads about whether we’re due a correction in the coming weeks, a data table caught our eye.
We’re referring to a great data pull from @SPYJared on Twitter, detailing what historically has happened after such a strong run in the index…
Looking at the stats
There are 23 cases in the past that can be analysed for the current situation that investors find themselves in.
We make three observations…
A sharp short-term move lower is unlikely
In the week after the eight straight weeks of gains, there have only been 5 cases of a negative break. Put another way, a 21.7% probability.
This isn’t insignificant, but it certainly doesn’t back up the theory of selling everything and entering leveraged short index trades.
A point we would flag is that Fed Chair Powell is going to be testifying on Wed and Thurs of this week. Given his rhetoric from last week saw equity markets trade higher, it could provide another stimulus for this week to finish the green.
We could be in for a strong Q3
In the quarter that followed the eight-week gains, the average return was +13.72%.
The max drawdown from the data set is quite significant, with the worst performance seeing a 37.57% fall. The strongest return over this period was a gain of 39.04%.
Could Q3 2023 offer us a return similar to the historical average? The green line below highlights where a 13.72% return would take us on the composite index.
Our takeaway is that we wouldn’t even be breaking 2022 highs on this trajectory, so we feel this outcome is more than possible.
Long-term sentiment is positive
When we consider the annual performance after an eight-week surge, the average performance is quite staggering. An average return of 82.65% couldn’t have surprised us when we first saw the data set.
The big question is, does the fundamental picture support a long-term rally? We argue it could do, depending on developments over the coming months.
If the US avoids a recession, the Fed take to a dovish pivot on policy, China stimulus helps to kickstart growth, the Russia/Ukraine war ends peacefully, and other factors kick in - it’s not unrealistic to think that the stock market could have a solid run in the coming year.
Risks to our view
A big concern is whether or not the US does enter a recession in the coming year. Probability calculations (Estrella and Mishkin being shown below) highlight that the chances of the US entering a recession over the next year is rising.
When we look at Core PCE inflation (the Fed’s preferred gauge), it also is becoming increasingly sticky around the 4.6-4.7% mark. A more aggressive policy response to try and bring this down could be the straw that breaks the camel’s back regarding the NASDAQ performance.


