

You Asked, We Answered
Answering messages to end the week.
, Michael Burry has an email from the film's director, Adam McKay, in his inbox : r/MovieDetails")
We’re always striving to engage with our growing community, both to continue tailoring content to your interests and to provide you with value.
Earlier in the week, we posted a message on our social media in an AMA (Ask Me Anything) style, where we collated the responses and answered them as best we could.
The response was great, so we’ve picked a handful and answered them below. Although this isn’t a new series, if you like the style of this, please drop a like and comment, and we’ll gauge whether to make it a more regular feature from the team.
‘What’s your take on the ECB meeting and what it means for EU interest rate expectations through to year-end?’
The latest European Central Bank (ECB) meeting on Thursday went pretty much as we expected it to. Lagarde was fairly upbeat on the state of the economy and flagged that monetary policy was in a good place.
Of course, one of the caveats to the future policy direction was the uncertainty regarding US-EU trade relations. Interestingly, when asked about the trade rumours of a 15% tariff being imposed by the US, she said that the June baseline projections would still hold.
Although nothing has been signed since the meeting, we expect a 15% deal to be struck ahead of the Aug 1 deadline next week. Yet given that scenario, it doesn’t appear to have changed the ECB projections. In turn, we therefore believe the probability of further cuts through to year-end is diminishing fast.
OIS pricing is agreeing with us - on Wednesday, we had 22bps worth of cuts priced through to December. This now stands at just under 16bps.
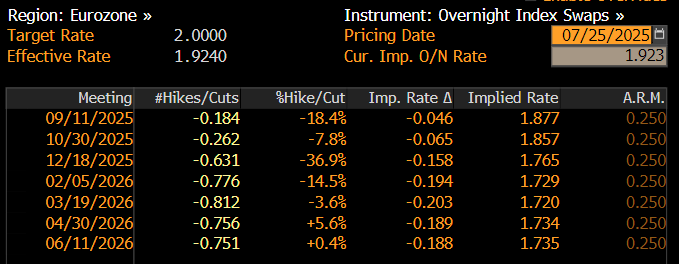
Suppose underlying inflation continues to soften and a trade deal is immediately struck without any nasty surprises. In that case, we’d be looking at some ideas in the rates space to express no further cuts (e.g ERZ5 down to 98.00).
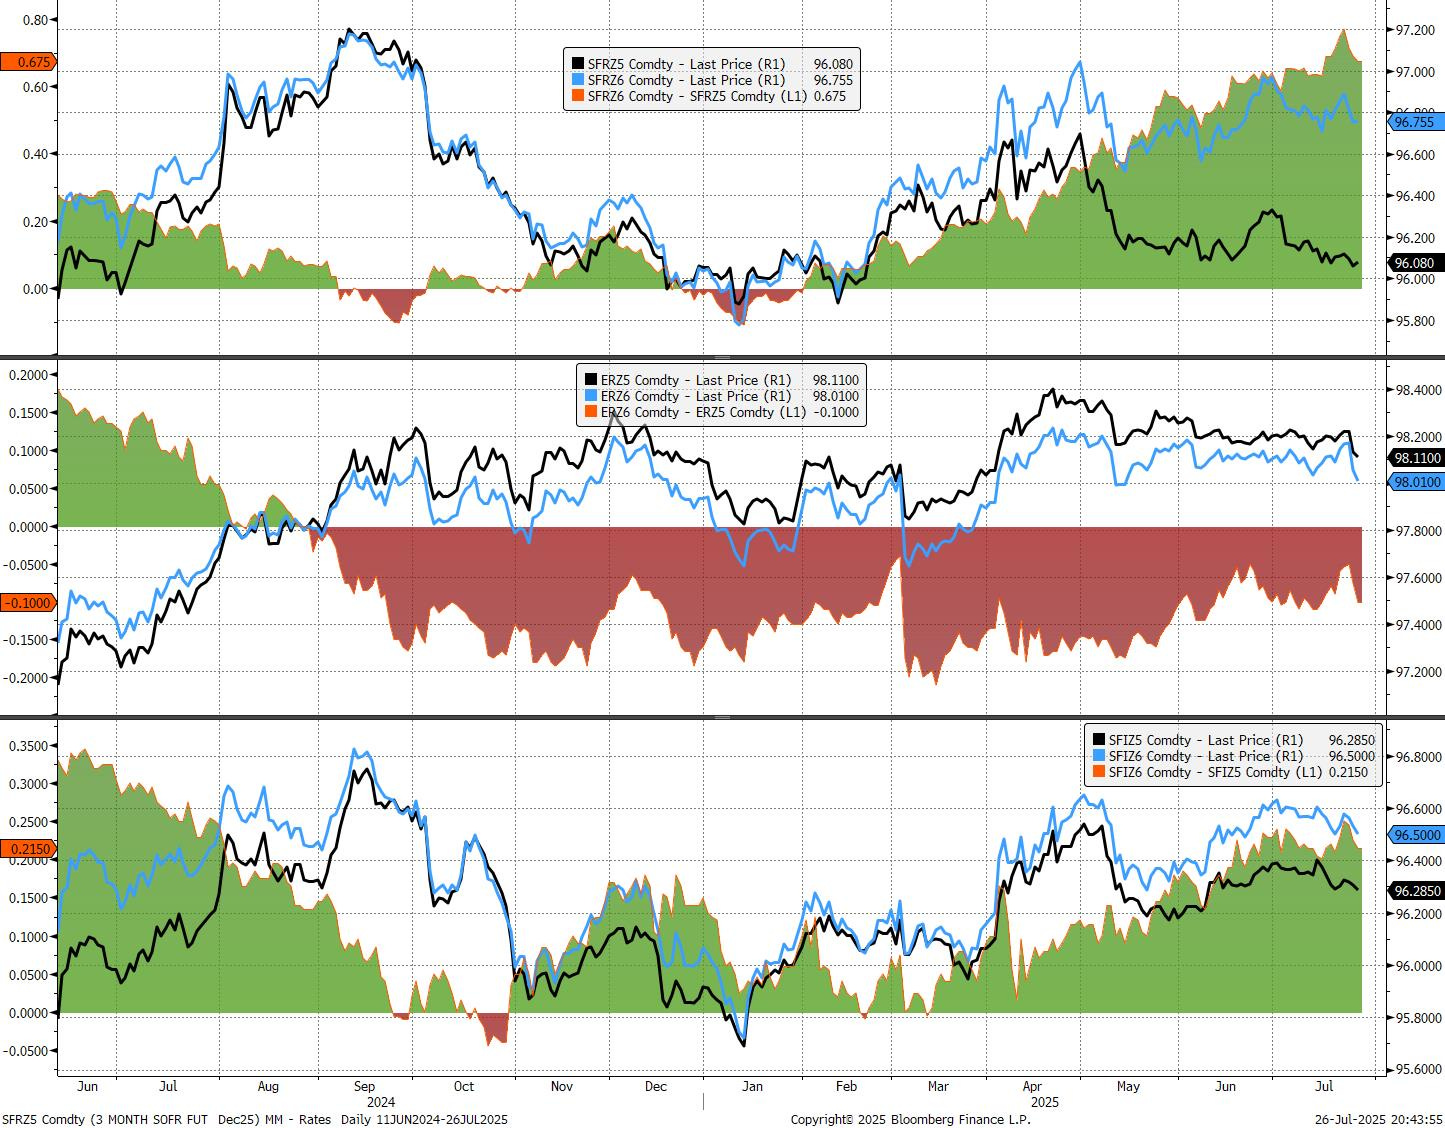
‘What’s the best way to structure STIR trades?’
We’ve put this here as it follows on nicely from the rates discussion on the ECB. Before we get to the right structure, we first have to identify pricing dislocations.
The dislocation exists if our view on a central bank policy expectation differs enough from the current STIR pricing (SOFR, SONIA, etc). If it’s in line with our view, then there’s nothing to structure. Let’s assume, in this case, that there is a dislocation whereby we feel the market is overpricing, given that Fed cuts are expected into late 2025 and 2026.
The structure variations are usually split between a directional play (such as selling SFRZ5) and a curve expression (like a bear steepener). Occasionally, we’ll look at something funkie, such as buying options on futures.
We pick the directional trade when we have a strong, high-conviction view on the absolute level of rates. This gives us the ability to have high leverage and direct exposure to our view, but does carry significant carry and roll risk if the market takes time to adjust.
If our view is slightly longer-dated or more about the shape of the yield curve, we go for a curve expression. Curve trades reduce exposure to parallel rate shifts and are particularly useful when we believe some parts of the curve are mispriced relative to others. These structures typically have lower carry costs and hedge broader macro uncertainty, which is why this is our usual way to trade STIR. However, we’ve been stung before with a lack of P/L, as if the entire curve moves in a parallel shift, you don’t get the benefit.
We only use options for isolated, event-driven scenarios—typically around central bank meetings. As with options on other assets, the main appeal is the asymmetric payoff and limited downside. They're also useful when you think the market is underpricing volatility or when you want to express a low-conviction, high-upside view on policy outcomes or political events like elections. In essence, these are high-risk, high-reward rate bets, with the usual drawbacks: theta decay, IV crush, and all the rest.
As a shameless plug, if you want to see rate pricing and spreads, check out our Macro Monitor…
‘What’s your view on the narrative that credit expansion drives stock market rallies?’
Before we get into the deeper thoughts here, we’ve seen some supposed experts on social media using M2 money supply as a way of depicting credit expansion. Although it’s related to credit, it’s not a perfect or direct measure of it and shouldn’t really be used in this sense.
M2 includes cash, checking deposits (M1), plus savings accounts, small time deposits, and retail money market funds. When banks make more loans, they create deposits, which increases M2. If banks are actively lending, and consumers or businesses are borrowing, M2 tends to grow because those borrowed funds usually end up as deposits in the banking system. That’s the link, but in modern economies with QE and large savings buffers, M2 can grow without much real credit creation.
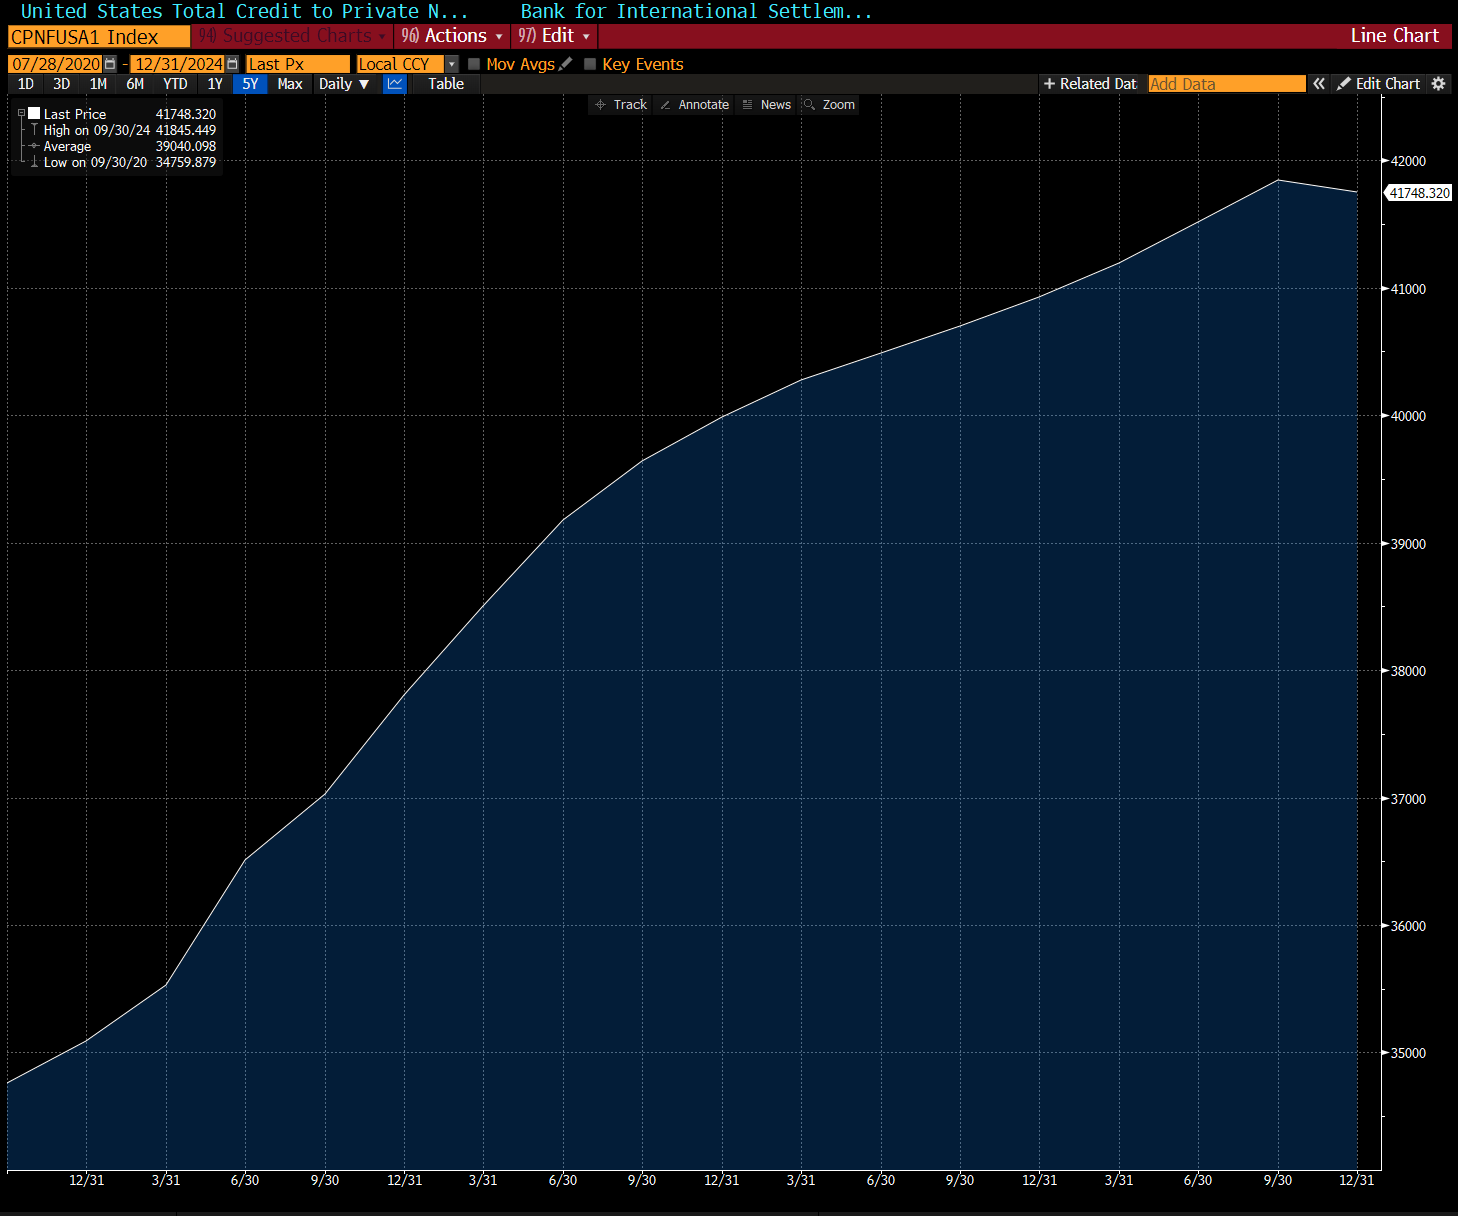
This turns us to now seeing if the current US stock market rally is being driven by credit expansion using barometers that we feel are a better gauge. There isn’t a perfect measure that’s updated daily. However, there are options. For example, BIS data for total private credit growth (CPNFUSA1 Index) is shown over a five-year timeframe below:
We also like looking at the Bloomberg US Credit Impulse indicator, which is released on a quarterly basis. It shows the change in the flow of credit to the economy, calculated by the YoY % change:
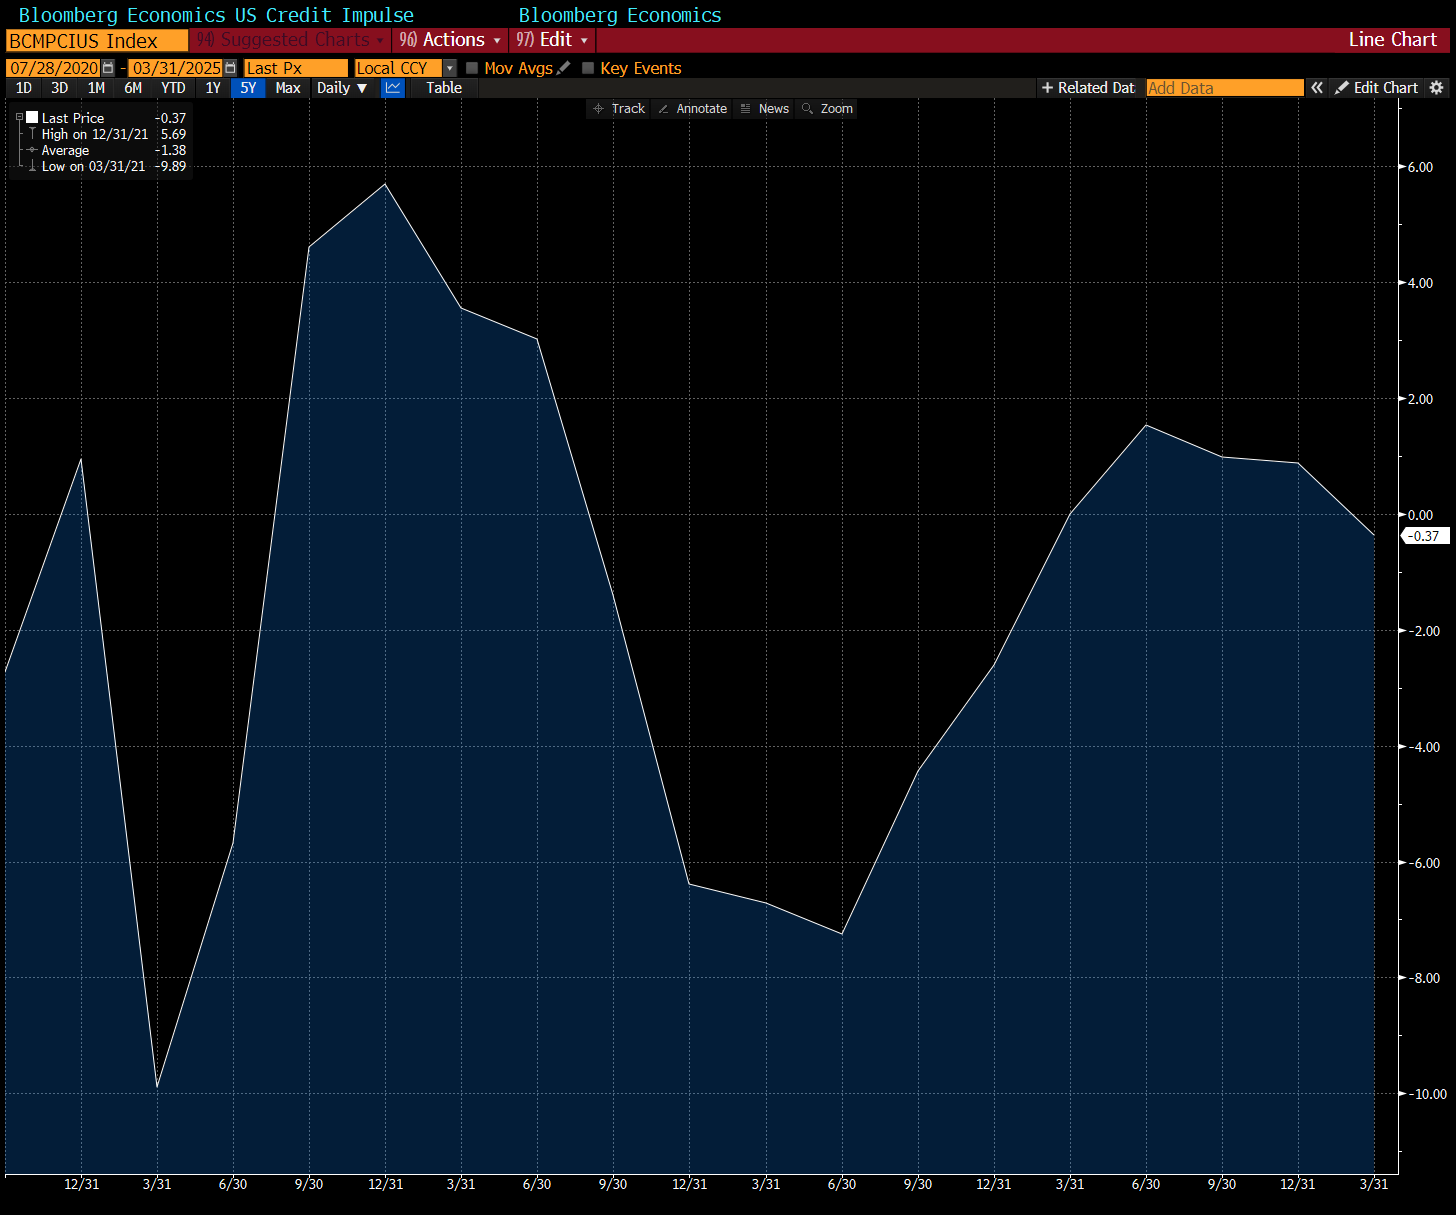
It’s true that neither of these metrics offers a ‘real-time’ gauge into credit conditions. But the market rally (excluding the blip in April) has been going for some time now, so it still allows us to draw conclusions.
Namely, even though at a broad level expansion in credit does help to fuel stock market rallies, we don’t feel it’s a key factor in driving the current bull market in the US. In order to tag it as a driving factor right now, we’d expect to see credit impulse as a positive % YoY change, and a much stronger increase in total private credit growth.
‘What’s your S&P 500 year-end price forecast?’
We thought there would be at least one comment come through about US equities, and we weren’t wrong. Before we share our thoughts, here’s what the Street thinks:
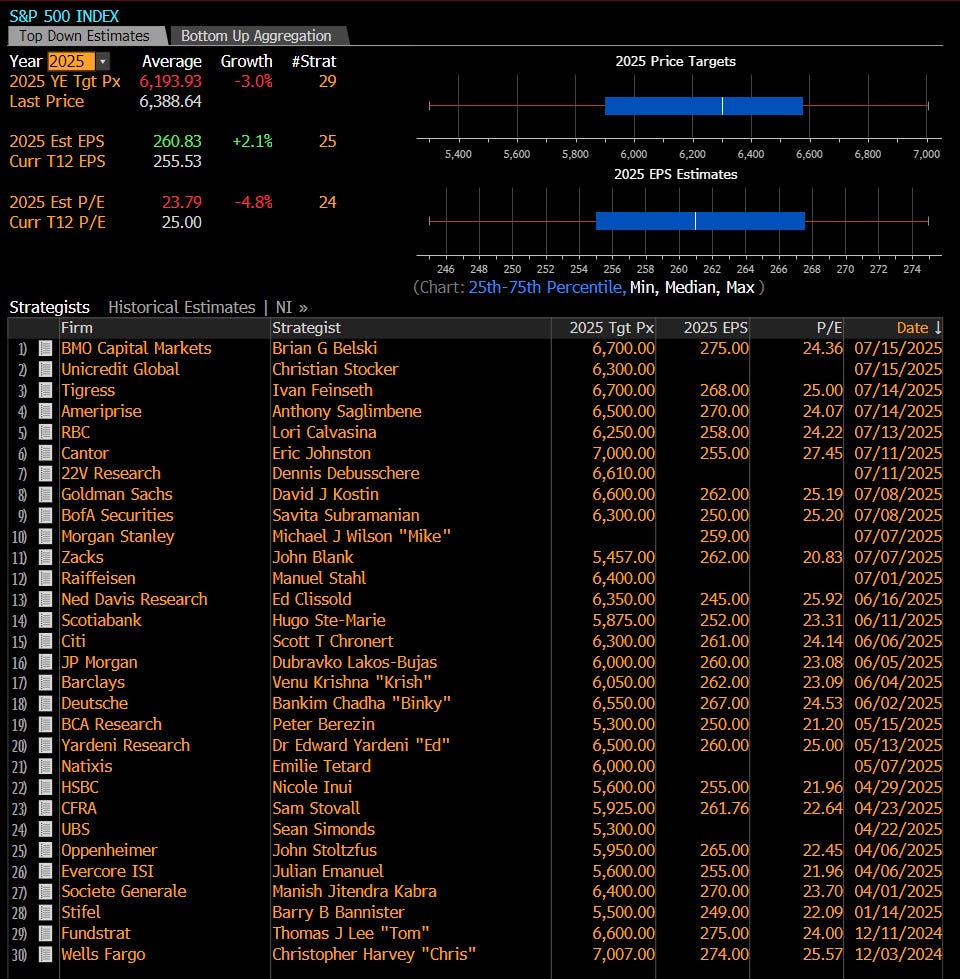
To be honest, we’re not a fan of offering forecasts on something like the S&P 500, and have been critical of the flip-flop nature of views on the Street.
Although we don’t have a specific figure to offer, our helicopter view is that we feel the current backdrop is constructive for the index to push higher. We’re in a situation where the shock factor of Trump headlines has diminished, meaning that a correction like we saw in April is highly unlikely.
Further, the concern around fiscal instability is being expressed in the Treasury space, not in equities, and we feel this will stay the same in the coming months. As for monetary policy moves, the shift towards rates staying higher for longer has been at a measured enough pace not to spook equity investors. Given where current pricing stands, we see little within monetary policy that could cause a correction. If anything, the risk is skewed the other way, in that if Powell does depart early, his replacement will likely be more dovish.
Earnings season has been strong so far, and with key themes such as AI still in full flow, we have to keep dancing to the market tune. The music hasn’t stopped.
 | Alex on Film")
Does the market keep going up forever? No. But we can’t see much on the horizon to validate the doomsayers. Of course, we are still holding downside option exposure, but this is more because you want to buy puts when you can, not when you suddenly have to.
That’s all from us today, see you tomorrow for the usual Monday rundown.
AP
Enjoyed this 🦉
Nicely answered!