

Global Primer Series: Corporate Bonds
Understanding corporate debt and exploring why the conversation is getting louder.
Corporate bond markets just got a new heavyweight entrant: Big Tech.
Related companies are selling record amounts in corporate bonds to fund the industrial-scale build-out of AI. Earlier this week, Meta sold around $30 billion of unsecured senior notes, the largest single high-grade tech bond sale of the year. Meanwhile, Amazon returned to the US debt market for the first time in three years, raising roughly $15 billion to underwrite its next wave of AI-driven cloud and logistics investments. Alphabet recently tapped both US and European credit markets for about $25 billion to fund the expansion of AI and cloud infrastructure worldwide.
Stack it all up, and the picture gets even louder. Since the start of September, Big Tech issuance alone has accounted for $90 billion1 in investment-grade debt issuance. For reference, this is more than double the annual run rate seen during the prior decade. Per Morgan Stanley, tech firms are expected to tap debt markets for as much as $1.5 trillion by 2028.

For bond investors, that means something new. Buying corporate debt provides exposure not to pipelines or power stations, but to data centres, AI hardware, cloud grids, and sprawling compute-intensive infrastructure. The “risk-free” halo around Big Tech credit is dimming just enough for spreads to wobble, and for investors to start asking the tough questions about returns on AI capex, power demand, and the runway for monetisation.
With that backdrop in place, it’s time to return to our Global Primer Series and strip corporate bonds back to basics.
When a business wants to expand, acquire, or simply roll its existing debt, it turns to the credit market. In exchange for capital, investors get a promise of periodic coupon payments and the return of principal at maturity.
But that promise carries risk. Unlike government bonds, corporates embed the possibility that the issuer could stumble or fail outright. That’s why corporate bonds don’t just trade at the risk-free rate. They trade at a spread.
This credit spread is the heartbeat of the market. It’s the price investors demand for taking on default and liquidity risk. And inside that spread lives the story of a company’s balance sheet, its competitive position, the cycle, investor sentiment, and, when things get shaky, fear.
Understanding corporate bonds is essentially about understanding credit spreads: where they are, why they move, and what they reveal about risk appetite and the economic outlook.
In this primer, we’ll run through:
- Structure and types
- How to price
- Understanding credit risk
- Market structure
- Trading and hedging strategies
- Notable events and current market dynamics
Structure and Types
Corporate bonds vary widely across ratings, maturity, and structure. At issuance, each bond is given a rating by one of the major ratings agencies:
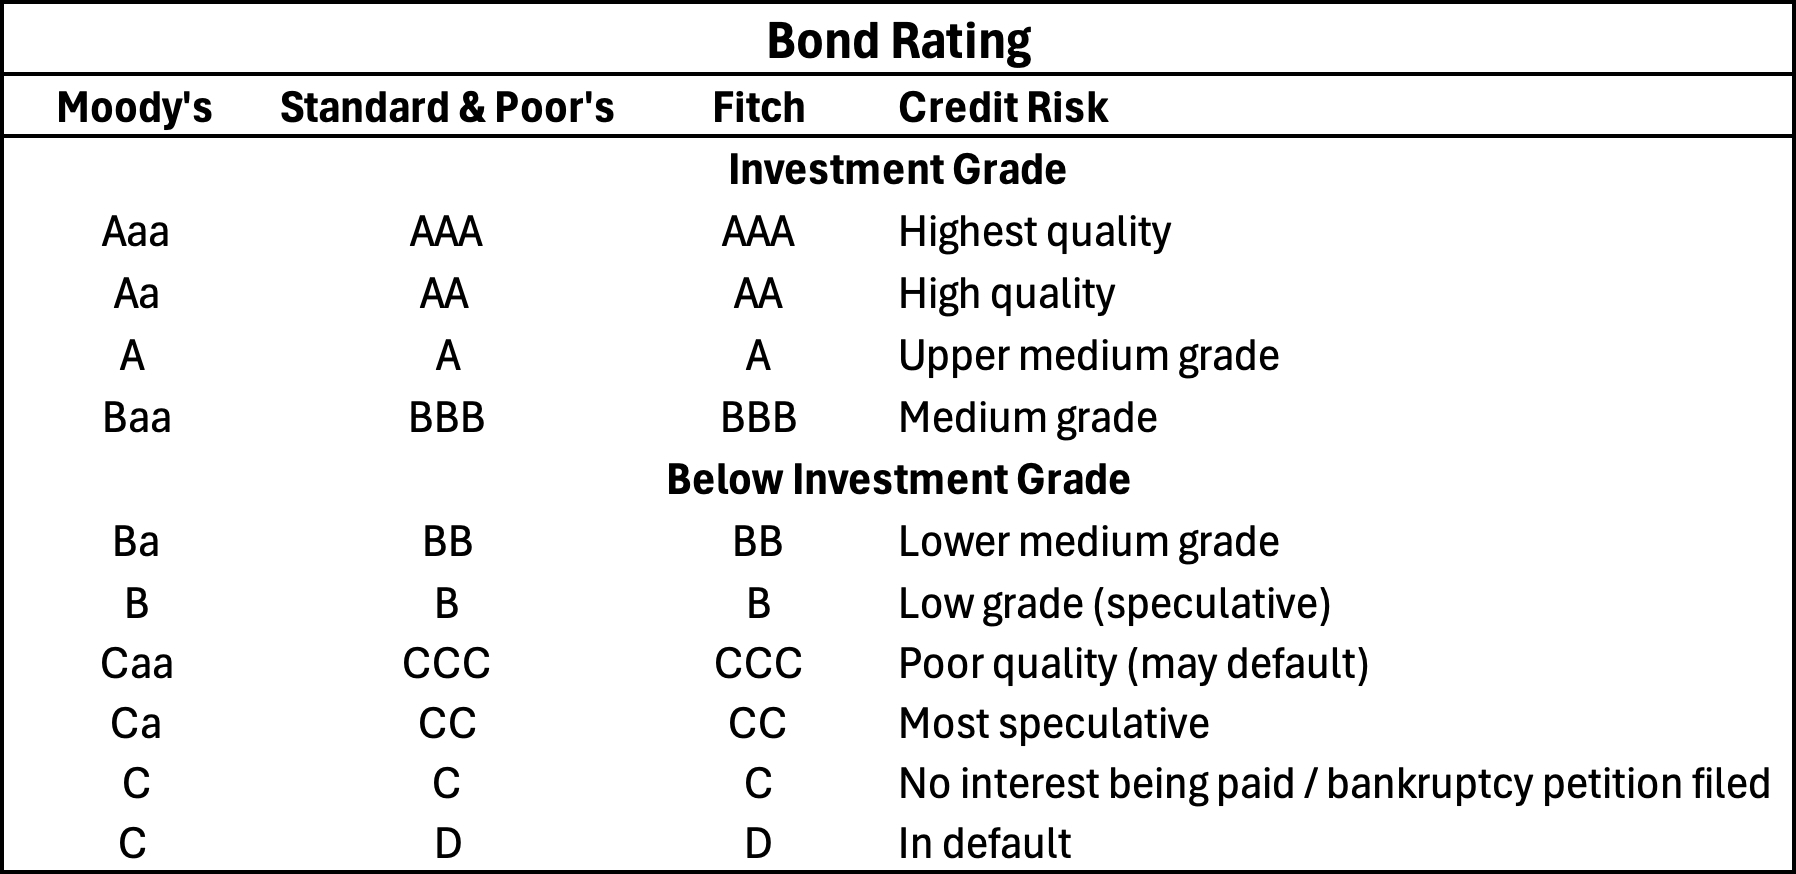
The grading is split into two. An investment-grade (IG) status is for any bond rated BBB–/Baa3 or higher. These are from stable issuers with lower yields, benchmarked against indices such as the Bloomberg US Corporate Bond Index.
In contrast, high-yield (HY) is for ratings below BBB–/Baa3. Also known as “junk bonds,” they offer higher coupons, higher default risk, and trade more like equities in stressed conditions.
Fallen angels, rising stars, and split ratings:
A fallen angel is a formerly investment-grade issuer whose credit quality has deteriorated enough to be downgraded into high yield. A rising star is the mirror image: a company upgraded from speculative grade into investment grade as its fundamentals improve. Because credit ratings involve judgment, agencies don’t always align, an occurrence known as a split rating.
Each of these situations can create opportunities for investors willing to take on additional risk, as the associated rating volatility and index-driven flows can offer pockets of extra yield.
Alternative Structures
Floating Rate Notes (FRNs) pay coupons linked to a short-term benchmark, such as SOFR, and reset periodically at the reference rate plus a fixed spread. This structure minimises duration risk. When rates rise, coupons adjust higher, keeping prices stable. Issuers use FRNs when they expect rates to fall or want flexibility in refinancing; investors use them to earn credit spread without taking directional rate risk. In hiking cycles, FRNs are popular among money market funds and insurers seeking yield pickup over cash, while behaving more like credit instruments than bonds.
Callable Bonds embed an option for the issuer to redeem the debt early, usually once rates have fallen or credit has improved. They carry negative convexity—prices rise less when yields fall because the bond may be called away—and therefore offer higher coupons to compensate. Callable structures suit issuers in volatile rate environments and investors who are comfortable trading yield for optionality.
Convertible Bonds flip the equation, giving investors the right to convert debt into equity at a preset price. They combine coupon income and principal protection with potential equity upside, effectively a bond plus a call option on the stock. Issuers benefit from lower coupons; investors gain asymmetric exposure to credit and equity risk. Convertibles perform best when volatility is high and growth optimism is returning.
Puttable Bonds give the investor, not the issuer, the option to sell the bond back to the issuer at par on specified dates before maturity. They’re essentially the mirror image of callable bonds. The put feature protects the holder against rising interest rates or credit deterioration. So if yields spike, spreads blow out, or the issuer’s fundamentals weaken, the investor can “put” the bond back and reinvest at higher prevailing rates. Because this embedded option is valuable to investors, puttable bonds typically offer lower coupons than comparable straight bonds.
Structural Features
Sinking fund provisions require the issuer to retire a portion of the bond’s principal on a scheduled basis before maturity. These amortisation payments reduce the amount outstanding over time, lowering refinancing risk and providing bondholders with incremental credit protection. While it softens default risk, a sinking fund can also introduce reinvestment risk, since investors receive principal back earlier than a bullet maturity.
Make-whole calls let issuers redeem bonds early, but only by compensating investors for the present value of foregone coupon payments, typically using a Treasury benchmark plus a contractual spread. Because the make-whole premium is designed to leave the investor economically indifferent, these calls rarely get exercised unless the issuer faces significant strategic or financial incentives. Bonds with make-whole calls tend to trade more like non-callable paper, with investors treating the provision as a modest backstop rather than a meaningful source of call risk.
Refunding protection restricts an issuer from calling a bond solely to refinance it with cheaper debt. This prevents issuers from opportunistically stripping investors of above-market coupons in falling-rate environments. Depending on the indenture, refunding protection can be partial or full, and can expire after a set period. It’s one of the more investor-friendly features in markets where callable structures are common.
The capital-structure position of the bond owned is important. Seniority determines where a bond sits in the payout waterfall during liquidation or restructuring. Senior secured is at the top, followed by senior unsecured, subordinated, and junior debt. Collateral provides an additional layer of protection when pledged, tying the bond to specific assets or cash flows. Higher seniority and collateralisation generally translate to lower coupons, tighter spreads, and higher recovery rates in distress. For investors, understanding exactly where a credit sits in the stack is crucial, since it often drives realised performance far more than yield at issuance.
Pricing Corporate Bonds
Corporate bonds contain several key pieces of information that investors will note down before deciding what action they want to take. For this breakdown, we provide as an example a JPMorgan USD bond that was issued in 2008 and matures in 2038:
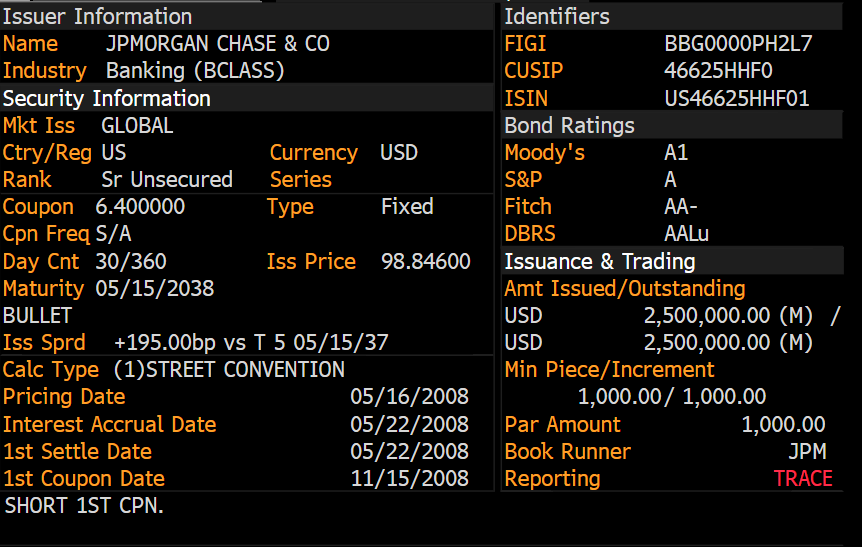
Let’s run through some of the basics…

From there, you can look at the current price in order to work out the yield:
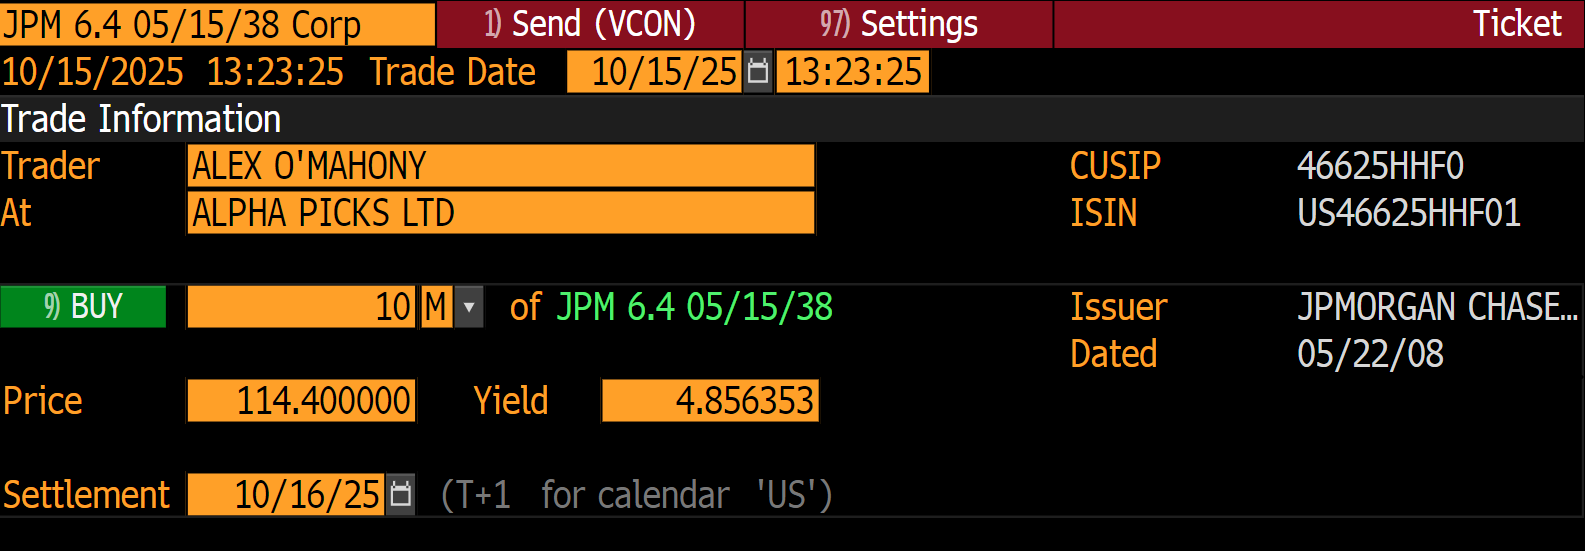
Given the bond is trading above par at 114.4, the yield is lower than the initial coupon (4.86% vs 6.40%).
Credit Risk, Default, and Curves
Credit Spreads
The market typically prices corporate bonds with higher credit risk than the comparable ‘risk-free rate’, often using the sovereign bond with the same maturity.
At issuance, this spread is noted. As in the case with the JPM bond, the added yield investors were compensated for in taking on the JPM bond instead of the corresponding Treasury was 195bps. This is known as the nominal spread.
Two other spreads worth noting down are:
Z-spread
The Z-spread (short for zero-volatility spread) is the constant spread added to the entire Treasury yield curve that equates the present value of a bond’s cash flows to its market price. In layman’s terms, the Z-spread tells you how much extra yield you’re earning over risk-free Treasuries if the bond’s cash flows are fixed and guaranteed to occur as scheduled.
It’s a cleaner, curve-adjusted way to measure credit risk than the simpler “nominal spread” (the yield difference versus a single Treasury).
OAS (Option-Adjusted Spread)
Many corporate and structured bonds have embedded options, which we discussed earlier. That’s where the OAS comes in.
The OAS takes the Z-spread and subtracts the value of any embedded options. In other words, it isolates the pure credit and liquidity premium after accounting for optionality.
Default & Recovery Pricing
Credit risk is the probability of loss from an issuer failing to meet obligations. The two key dimensions are:
Default Probability: Often implied from credit spreads or CDS levels. For example, with JPMorgan, a trader could take a look at the 5-year CDS pricing.
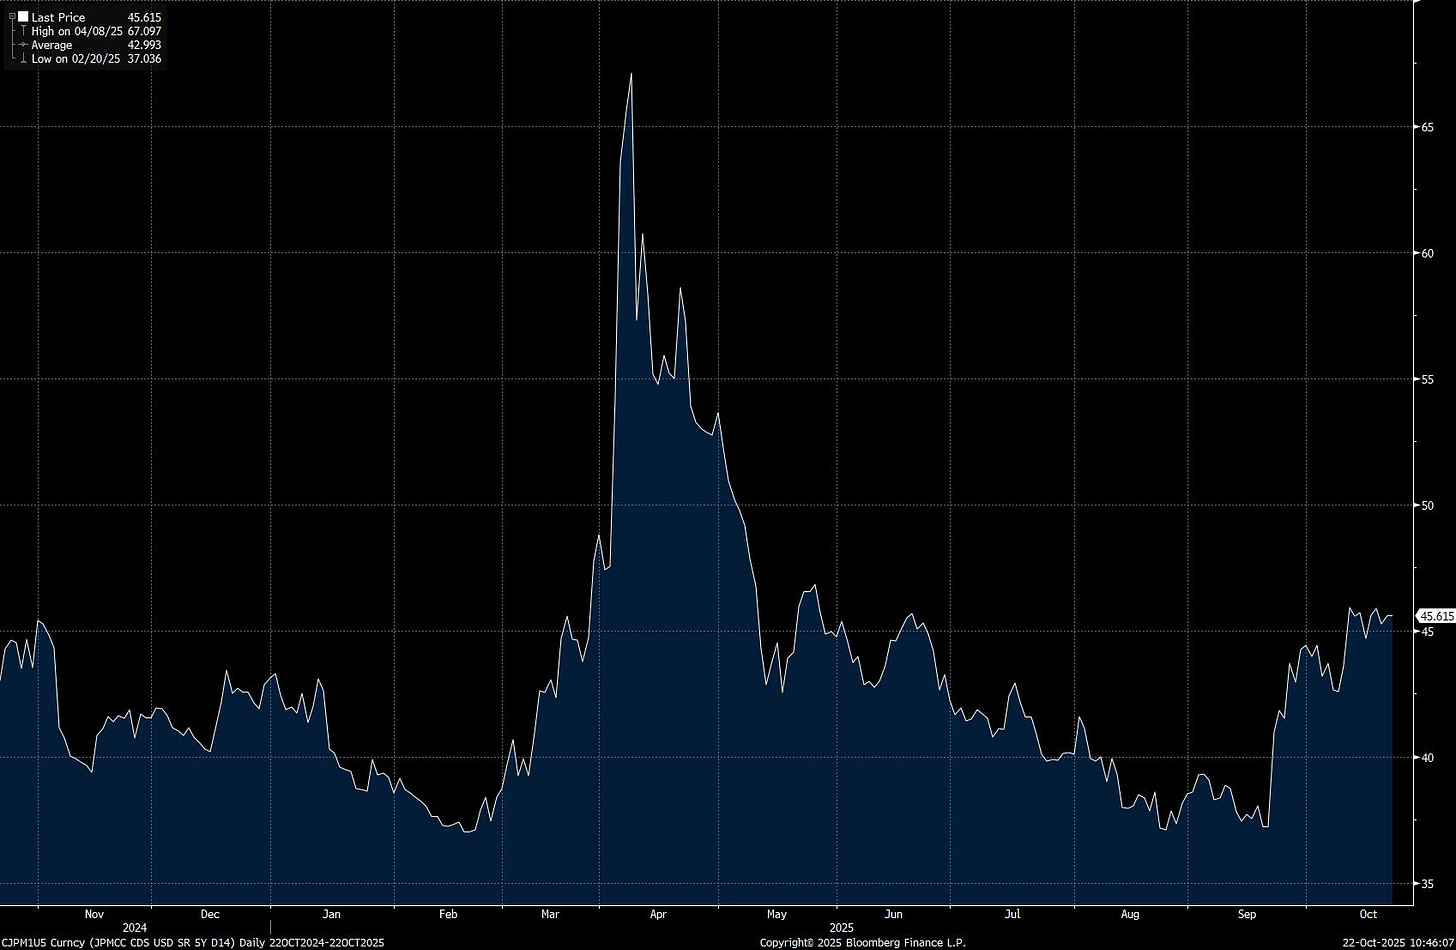
The CDS is at just over 45bps, meaning it costs approximately $45,000 per year to insure $10 million of JPMorgan debt against default for the next five years. The CDS figure can be converted using a rough rule of thumb to estimate the expected loss over this time period.
Recovery Rate: This is the portion recovered after default (typically 40% for unsecured senior bonds).
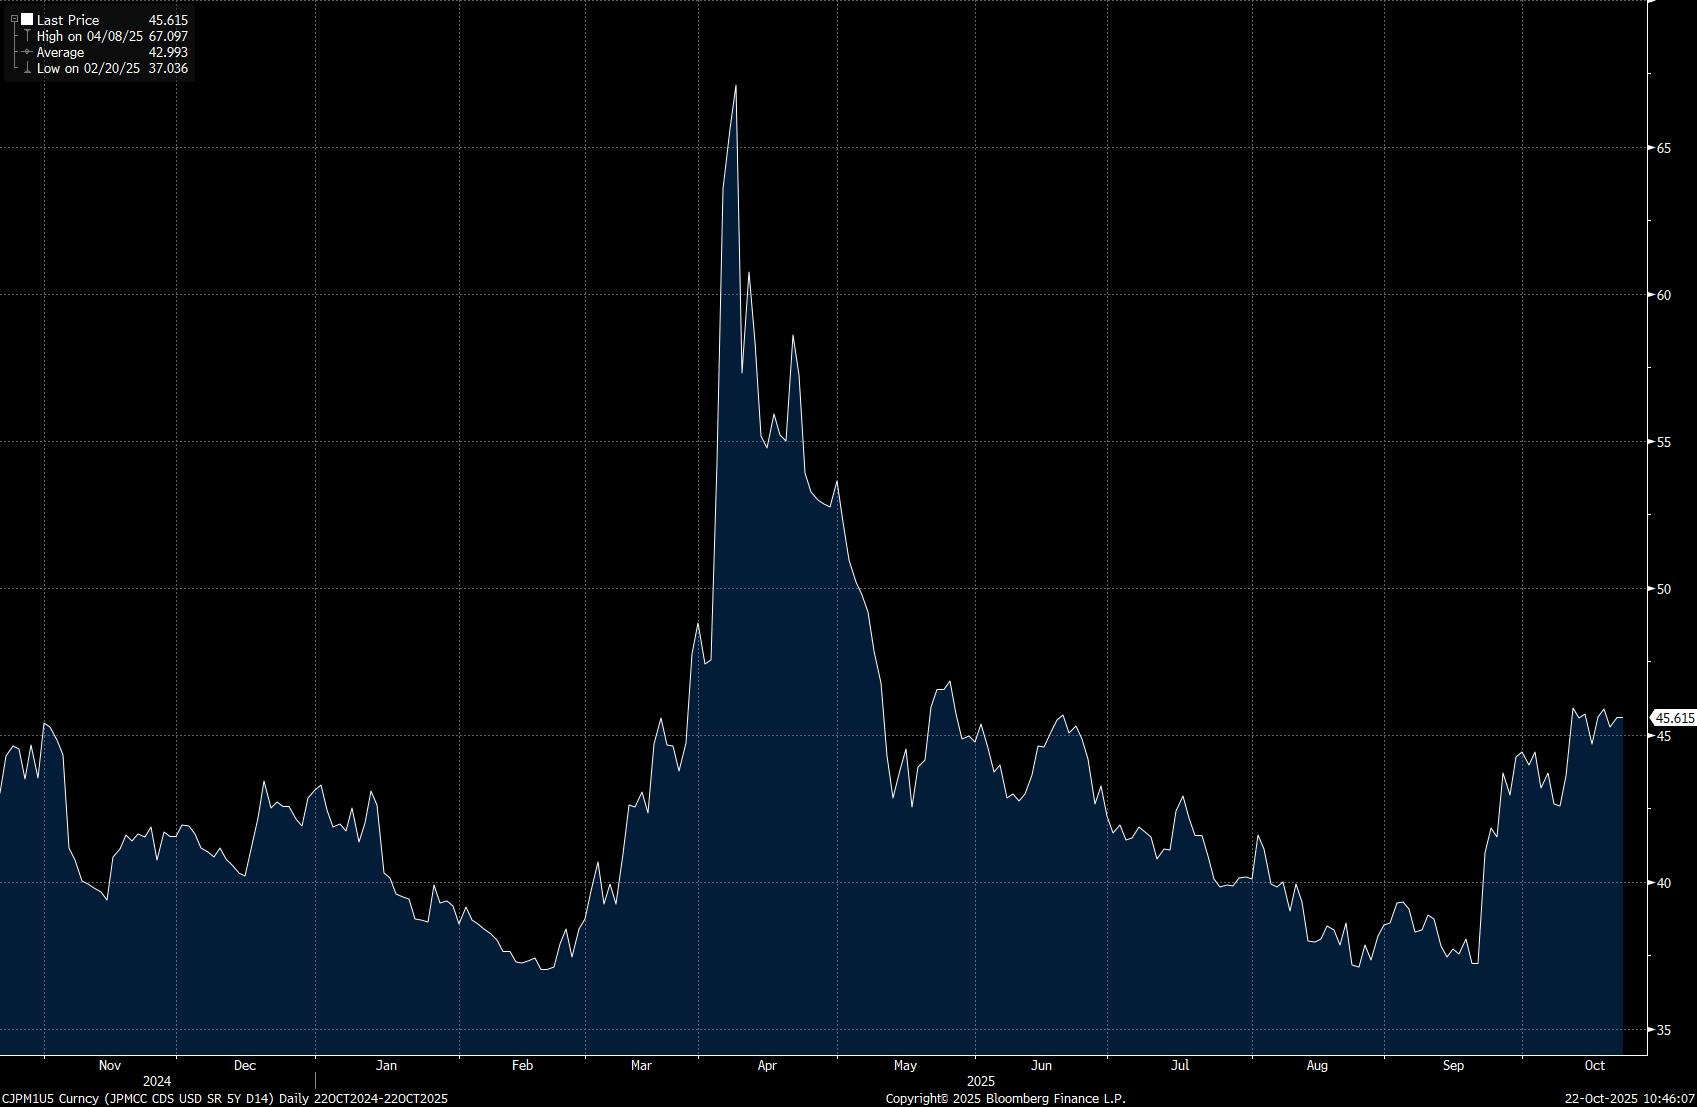
Expected loss = Default Probability × (1 – Recovery Rate)
In the example we’re examining, assuming a 40% recovery rate, a 45bps spread implies roughly a 0.75% cumulative 5-year default probability for JPM, or approximately 0.15% per year.
In practice, credit investors also price liquidity risk, downgrade risk, and systemic correlation when assessing creditworthiness.
The Credit Curve
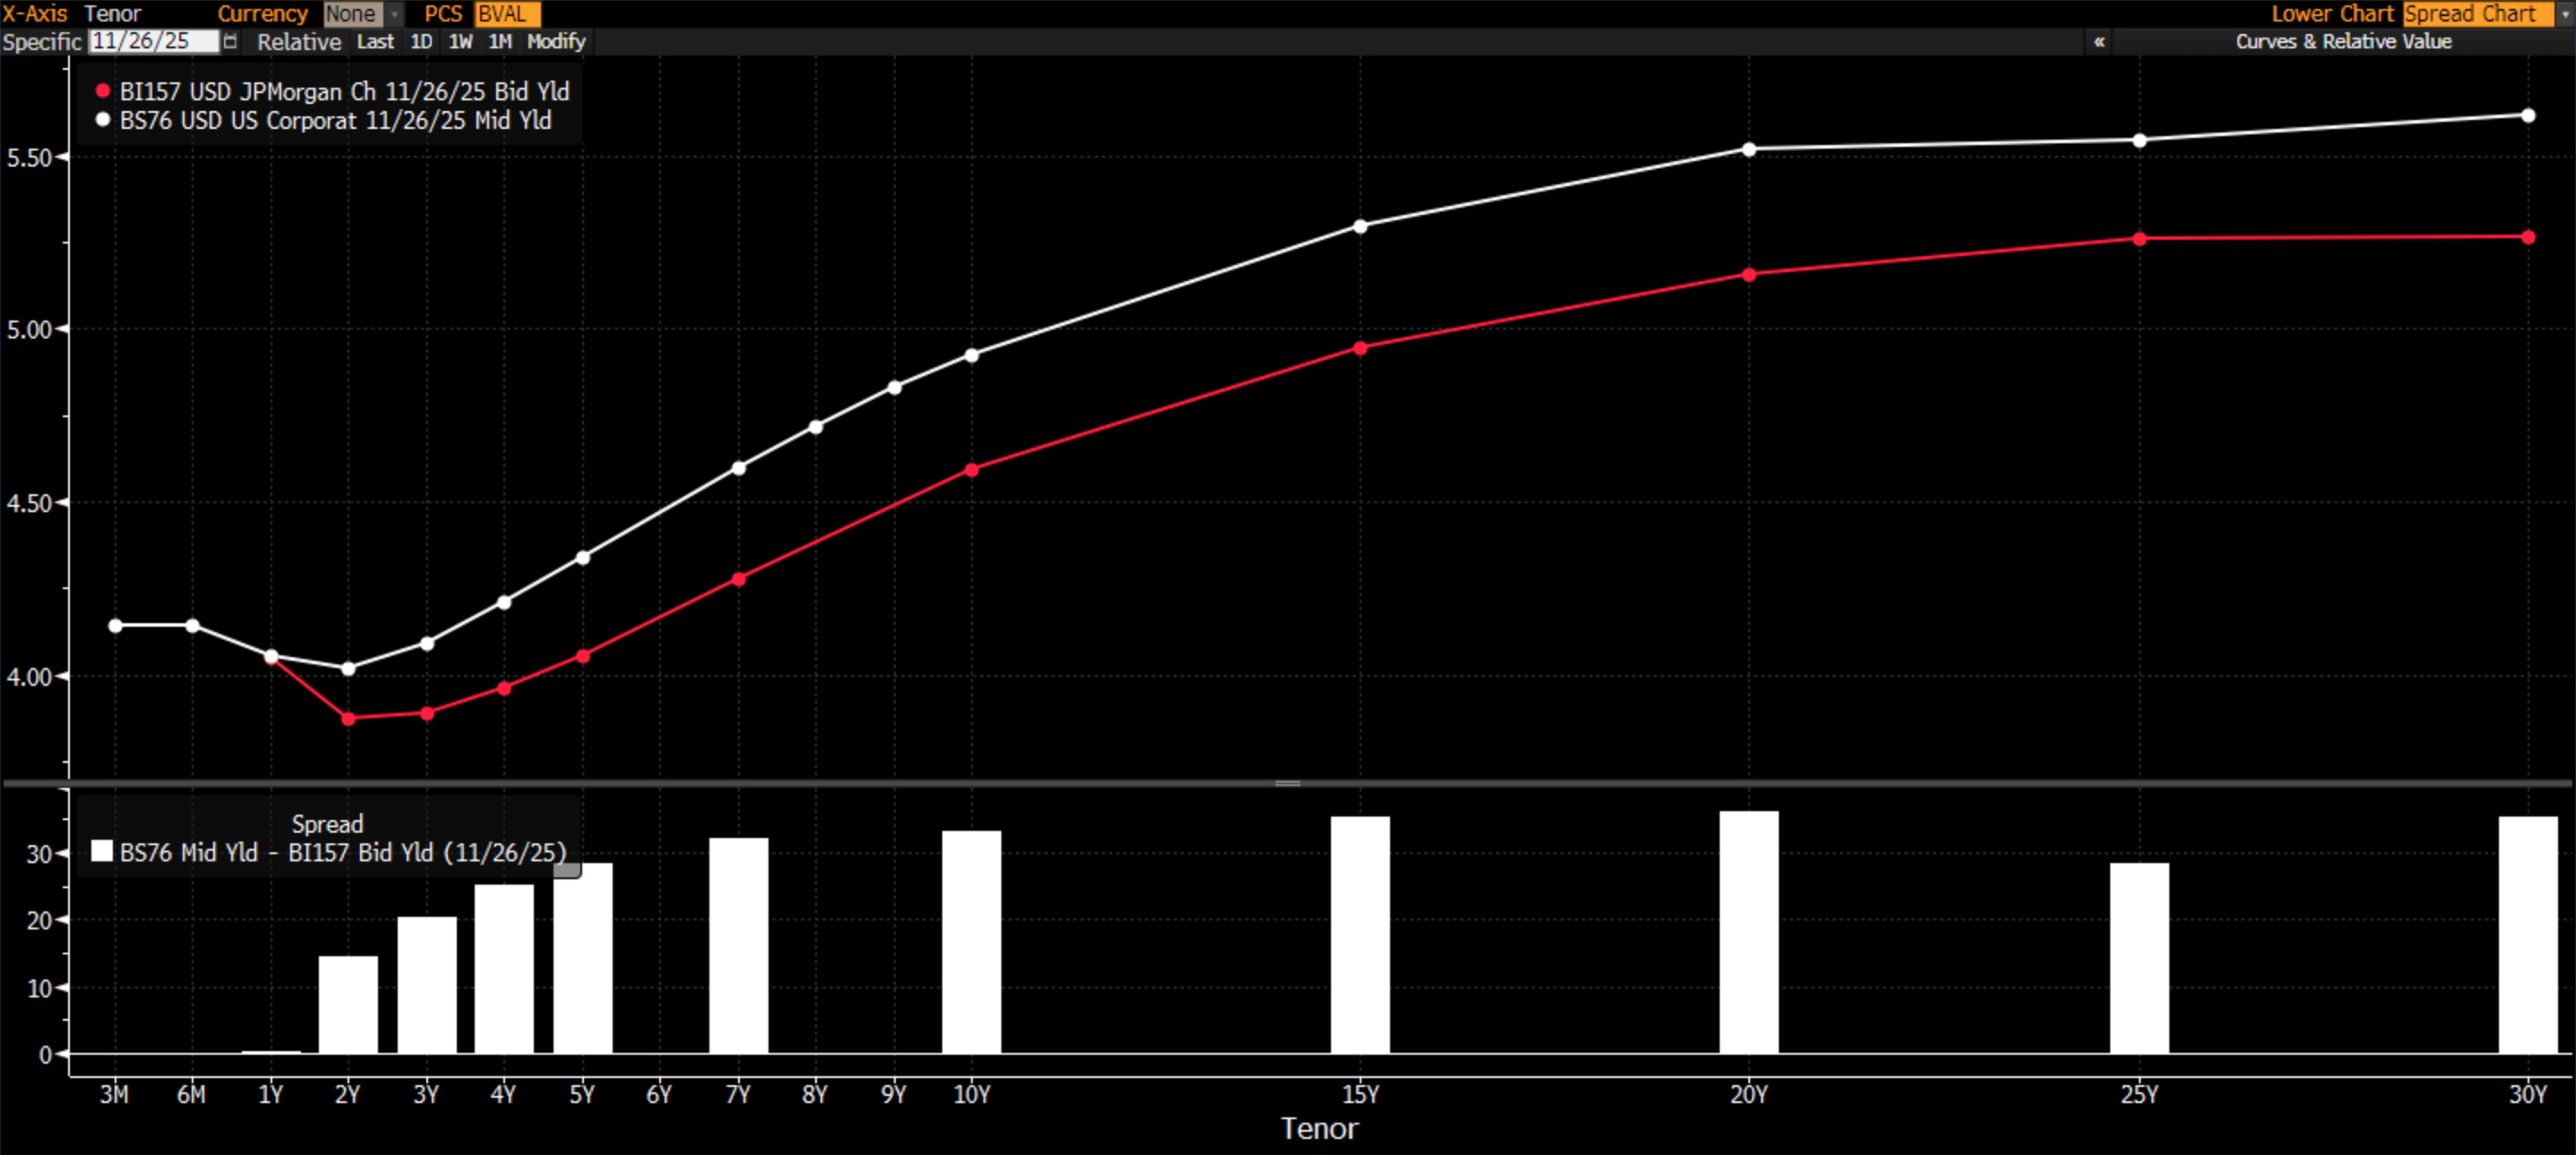
Just as Treasuries have a yield curve, corporates have a credit curve showing spreads across maturities.
In most conditions, the credit curve is upward-sloping, with longer-dated bonds having wider spreads than shorter-dated ones. Anyone who has studied markets knows that lending money for 10 years carries more uncertainty than lending for two years. Investors demand a higher premium to take on that duration and credit risk.
The curves can be plotted at a credit quality level or at a company-specific level. For example, the following shows the US IG Corporate curve, along with the JPMorgan one.
Risks Besides Credit
Although the market chooses to focus on credit as the key lens to view risk through, there are other risks to be aware of when it comes to trading corporate bonds.
Interest-rate risk is the big macro exposure. When yields rise, bond prices fall, and long-duration corporates get hit hardest. Liquidity risk comes next, especially in stressed markets where even investment-grade bonds can gap wider if dealers step back and balance-sheet capacity thins. Reinvestment and call risk show up when issuers take advantage of falling rates to refinance early, forcing investors to reinvest proceeds at lower yields just as the bond’s carry was becoming attractive. Downgrade risk is the slow-burn threat. If an agency moves a name from A to BBB, it tightens portfolio constraints, while a fall into high yield can trigger forced selling and sharp spread widening. And then there’s event risk, which is the unpredictable stuff, something we cover in more detail later on.
The Corporate Bond Market Structure
Unlike equities, which trade on centralised exchanges, corporate bonds trade over-the-counter (OTC) through a decentralised network of dealers and institutional investors. That structure makes it deep and liquid for large players, but opaque for everyone else.
At its core, the market is split into two tiers: primary issuance and secondary trading.
In the primary market, companies issue new bonds through underwriters (typically investment banks) that syndicate the deal to investors. Pricing is usually set relative to the Treasury curve or to swap rates, with spreads reflecting credit risk and investor demand.
Once sold, those bonds enter the secondary market, where they trade between dealers, asset managers, insurance firms, hedge funds, and other institutions.
Unlike equities, there’s no central order book. Instead, price discovery happens through dealer runs, platforms like Bloomberg, and direct RFQs.
As a quick historical detour: When Michael Bloomberg founded his company in 1981, his vision was to solve manual problems in the bond markets. Bloomberg’s idea was to create a data terminal for bond traders, giving them real-time prices, yield calculations, and analytics directly on-screen. The first product, called the Market Master terminal, was sold to Merrill Lynch in 1982. It let users analyse Treasuries, corporates, and mortgage-backed securities, calculate yields and spreads instantly, and price securities off the yield curve. This was a massive leap from the manual calculations traders used before.

The big dealers (JPMorgan, Citi, Goldman Sachs, etc.) act as liquidity providers, making markets for clients but also holding inventory risk. For large trades, liquidity depends heavily on dealer balance sheet capacity and market sentiment. That’s why bond liquidity can vanish quickly in times of stress: there’s no standing bid if dealers step back.
The market itself is vast and segmented. The IG universe forms the backbone of corporate debt, dominated by long-term investors like pension funds and insurers.
The HY segment attracts hedge funds and credit specialists seeking higher returns and higher risk. There’s also a growing market for private placements, 144A bonds, and ESG-linked issuance, each catering to specific investor bases.
On the trading side, technology has been reshaping the structure. Platforms like MarketAxess, Tradeweb, and Bloomberg’s ALLQ have brought partial transparency and electronic execution to what was once a phone-based market. For example, you can see the ALLQ strip for the JPM 2038 bond:
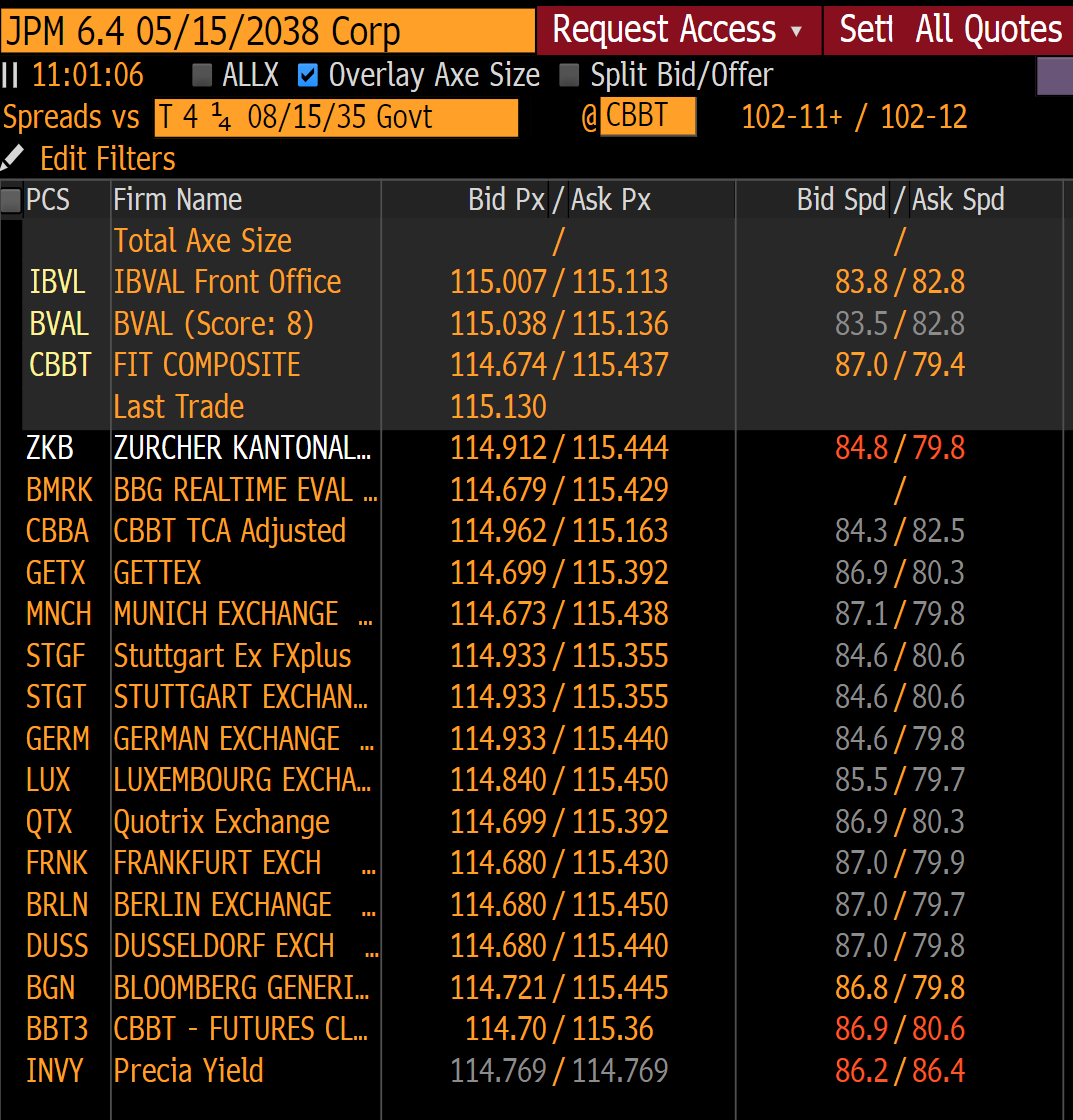
The shift to e-trading has made TRACE (FINRA’s reporting system) data more visible, but spreads and liquidity conditions still vary sharply by issuer, maturity, and rating.
Trading and Hedging Credit Risk
Institutional investors use multiple instruments to express or hedge credit exposure from corporate bonds.
Credit Default Swaps (CDS)
CDS contracts are the synthetic counterpart to cash bonds. A CDS buyer pays a periodic premium to hedge against default, while the seller collects that spread in exchange for taking on credit risk. They allow investors to go short credit, something that’s hard to do efficiently in the cash market. Hedge funds and bank trading desks use CDS for tactical trades around earnings, M&A, or idiosyncratic stress, while real-money accounts use them to fine-tune portfolio risk without selling bonds.
CDX Indices
CDX indices package dozens of CDS contracts into a single tradable exposure—investment-grade (CDX IG) or high-yield (CDX HY). This gives institutions an efficient way to take or hedge systemic credit risk. For macro funds, CDX is the instrument of choice when trading broad credit cycles, such as during periods of tightening or easing in financial conditions. Dealers use them to warehouse or offset client flow, while relative value funds arbitrage index vs. single-name spreads (“index basis”). Their liquidity and tight bid-ask spreads make them a benchmark for credit sentiment at the index level.
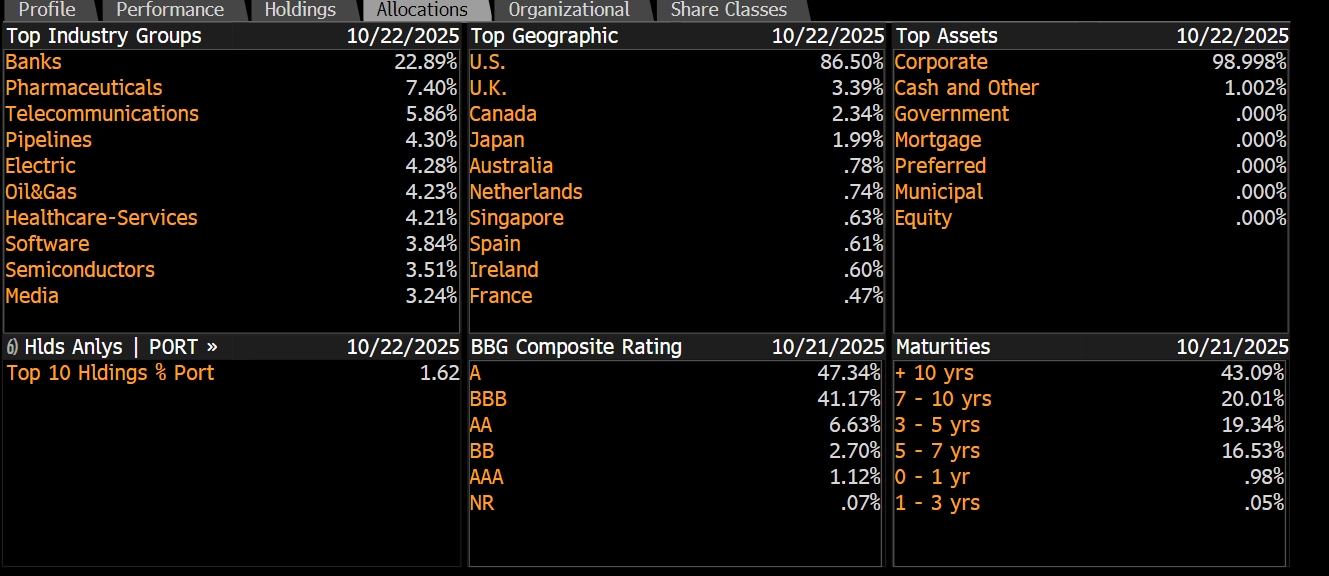
Bond ETFs
Bond ETFs, such as LQD (investment-grade) and HYG (high-yield), have become the liquid face of credit beta. They trade on equity exchanges, offering intraday liquidity that the underlying bonds lack. Institutions use them to quickly add or reduce exposure, hedge credit books, or proxy benchmark performance. In stress periods, ETFs can trade at discounts or premiums to NAV, effectively providing a price discovery mechanism when cash markets freeze. For that reason, LQD and HYG have become essential tools for both tactical positioning and liquidity management in modern credit portfolios.
Different ETFs have different allocations. LDQ is shown:
Until recently, institutional investors had no exchange-traded product that tracked credit spreads directly. Bond ETFs like LQD and HYG offered partial solutions, but they carry embedded interest rate risk and don’t isolate credit as cleanly. CDX indices solved that issue in OTC markets, but they require ISDA agreements and are less accessible for smaller institutions or systematic traders.
That’s where Credit Futures come in...
Credit Futures
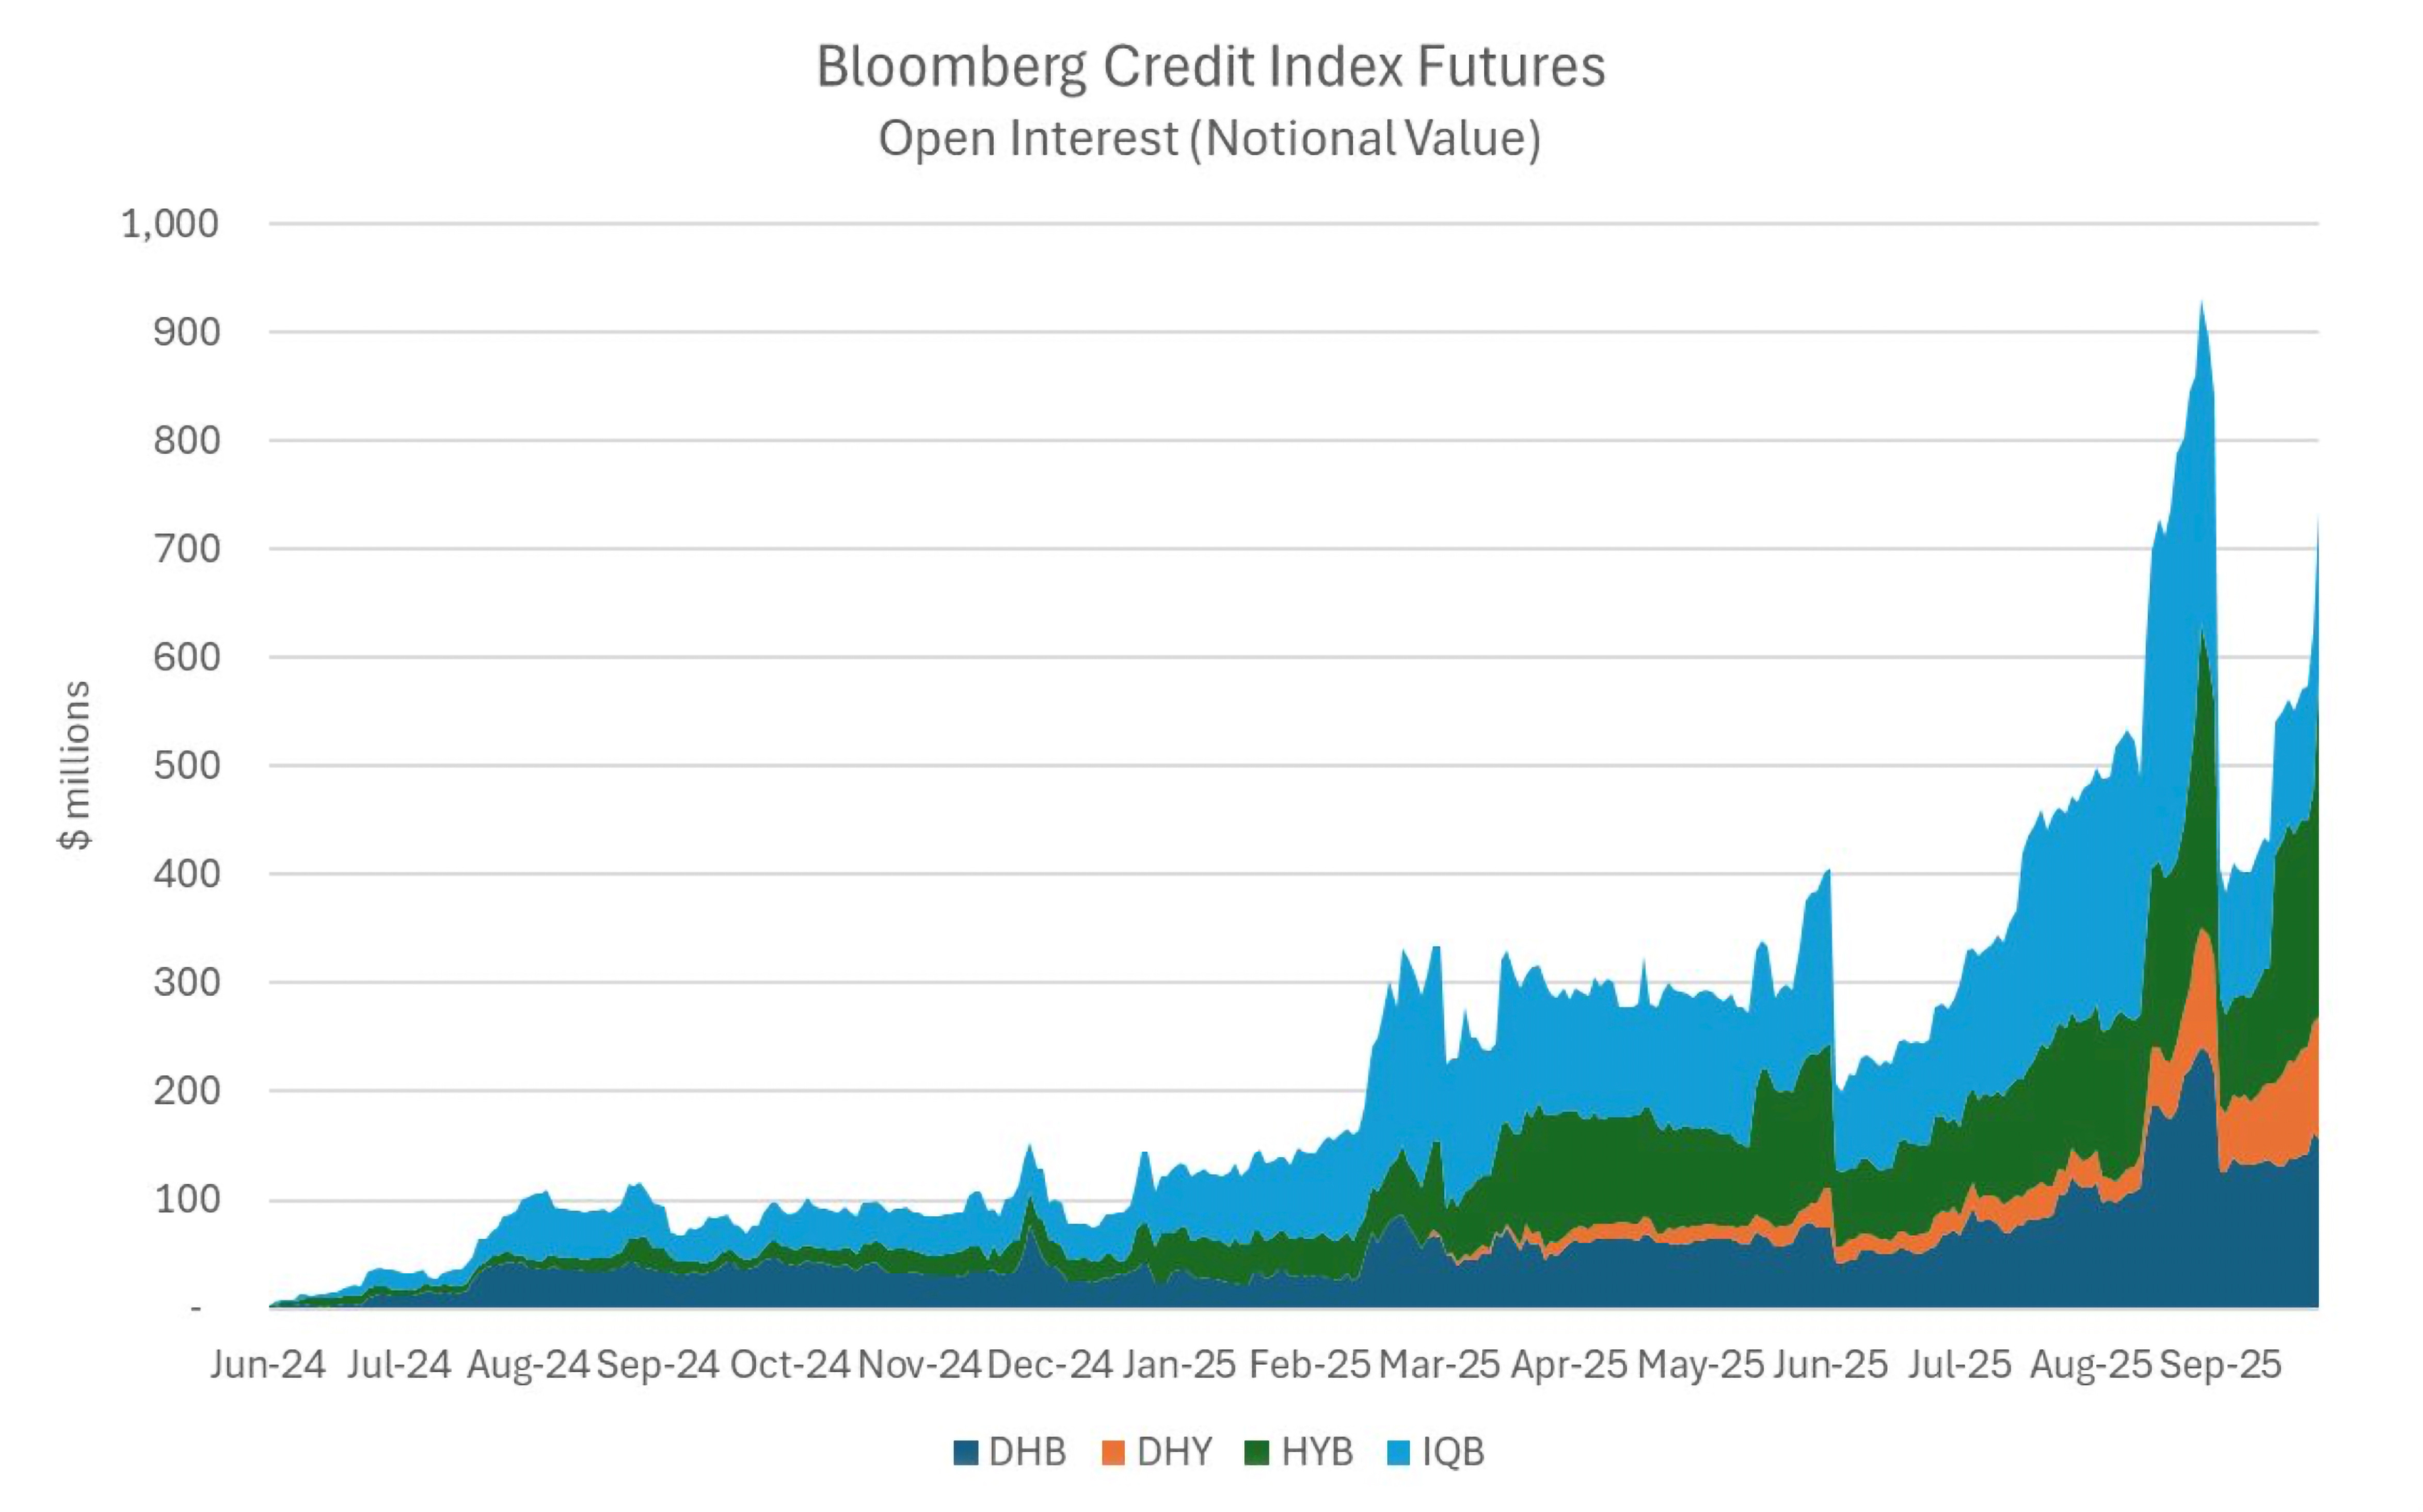
Launched by CME Group in 2023–24, CME Credit Futures constitute a significant innovation bridging cash bonds, ETFs, and CDS.
They’re futures contracts that are cash-settled to market-leading Bloomberg corporate bond indices. These effectively turn broad credit exposure into a transparent, margin-efficient, and easily tradable instrument. Each contract reflects a standardised credit spread level, allowing investors to gain or hedge credit beta with the simplicity and accessibility of futures rather than dealing with bilateral CDS contracts.
CME offer four main futures contracts, with one based on the Bloomberg US Corporate Investment Grade Index (IQB) and another on the Bloomberg US Corporate High Yield Very Liquid Index (HYB). Duration-hedged versions are also available. Growth in open interest over the past year has been significant, to say the least:
Notable Events and Current Market Dynamics
Three forces shape corporate bond performance:
Rates and Treasury yields drive the risk-free anchor. After all, the Corporate Yield = Treasury Yield + Credit Spread. When Treasury yields move, the entire corporate curve shifts with them, regardless of whether the company’s fundamentals change.
Spreads reflect credit conditions and investor appetite. We’ve spoken already about how credit spreads are calculated, but in short, we can say that IG spreads are more sensitive to macro growth and rate volatility, while HY spreads are more sensitive to default expectations and market sentiment.
Liquidity amplifies moves in both directions. Liquidity determines how quickly and how violently prices adjust, which is a major factor given that corporate bonds are OTC.
Enron, WorldCom, and the Early-2000s Credit Reckoning
In the early 2000s, the collapse of Enron and WorldCom exposed deep weaknesses in corporate accounting transparency. These weren’t fringe high-yield names; they sat in the investment grade universe, widely held in pension portfolios and core bond funds. When the fraud came to light, corporate spreads widened sharply across the market, not just in the companies involved.
Investors learned that credit ratings could be wrong, financial statements could be manipulated, and the concept of “investment grade safety” depended heavily on trust. This period reshaped credit research. Analysts became more focused on cash-flow durability, governance quality, and off-balance-sheet liabilities. It marked the moment corporate bond markets internalised that credit spreads also price uncertainty, not simply default probabilities.
The 2008 Financial Crisis and Liquidity’s Breaking Point
The failure of Lehman Brothers triggered a complete breakdown in the global financial system. Banks stopped lending to each other, dealers stopped committing balance sheet capital, and credit markets froze. Spreads didn’t just widen, but blew out to levels implying mass corporate default. Yet many companies were fundamentally solvent.
With dealers unwilling to intermediate and forced sellers needing cash, even healthy corporate bonds traded like distressed assets. It was only when central banks intervened—cutting rates, backstopping banks, and flooding markets with liquidity—that credit markets stabilised. This episode permanently changed market microstructure: liquidity could no longer be assumed, and the corporate bond market became more flow-driven and more policy-sensitive than ever.
The 2011 European Sovereign Debt Crisis
The European debt crisis began as a sovereign problem but quickly bled into corporate credit, especially in the banking sector. Investors questioned whether countries like Greece, Portugal, and Spain could repay their government debt. European banks, large holders of sovereign bonds, saw their own credit risk re-priced as default fears spread. The EU IG 5-year CDS spread hasn’t traded close to the 2011 levels since:

Even sound non-financial corporations were caught in the contagion because funding markets tightened and cross-border capital retreated. When governments wobble, corporate credit spreads widen, even without a deterioration in earnings.
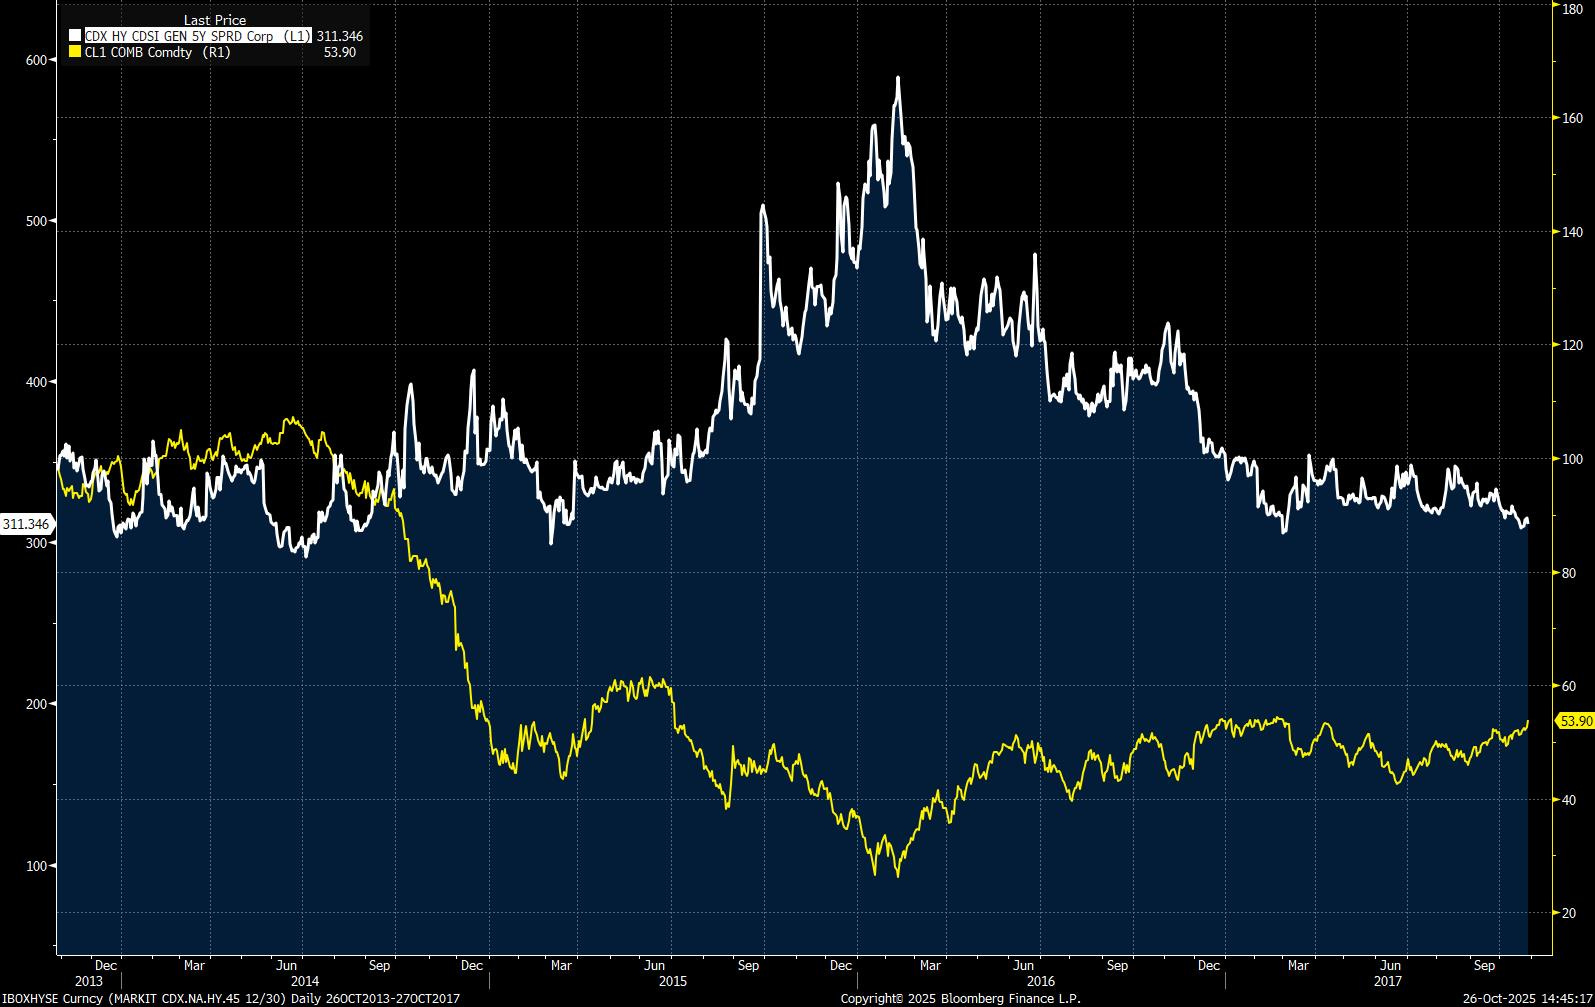
The 2014–2016 High-Yield Energy Bust
When oil prices collapsed from $100 to below $30, high-yield markets were heavily exposed to US shale producers, who relied on continuous capital market access to fund their drilling operations. Spreads in energy-related high-yield bonds widened over 1,000bps, defaults surged, and recovery rates were weak. The sector impact was enough to pull the HY market higher, demonstrating that sector risk can dominate broad-market credit spreads.
The December 2018 Liquidity Air Pocket
Late 2018 saw a sharp and sudden tightening of financial conditions as the Federal Reserve continued raising rates while global growth momentum slowed. Investor sentiment flipped risk-off, and liquidity in corporate credit evaporated. Primary issuance in high yield dropped to zero for the entire month, a phenomenon that had not occurred since the financial crisis. Prices gapped lower, not because solvency risks changed, but because dealers stepped away, and sellers found few bidders. This episode showed that the dealer's balance sheet is now a constraint in modern bond markets. When volatility rises, liquidity disappears quickly.
March 2020: The COVID Credit Shock and Fed Backstop
At the onset of COVID, fears of a sudden stop in global economic activity caused credit spreads to spike violently. High-yield traded like distressed debt, and even fundamentally strong investment-grade companies saw their financing costs soar. Liquidity froze until the Federal Reserve announced the Corporate Credit Facility, committing to buy corporate bond ETFs and individual issuers if needed.
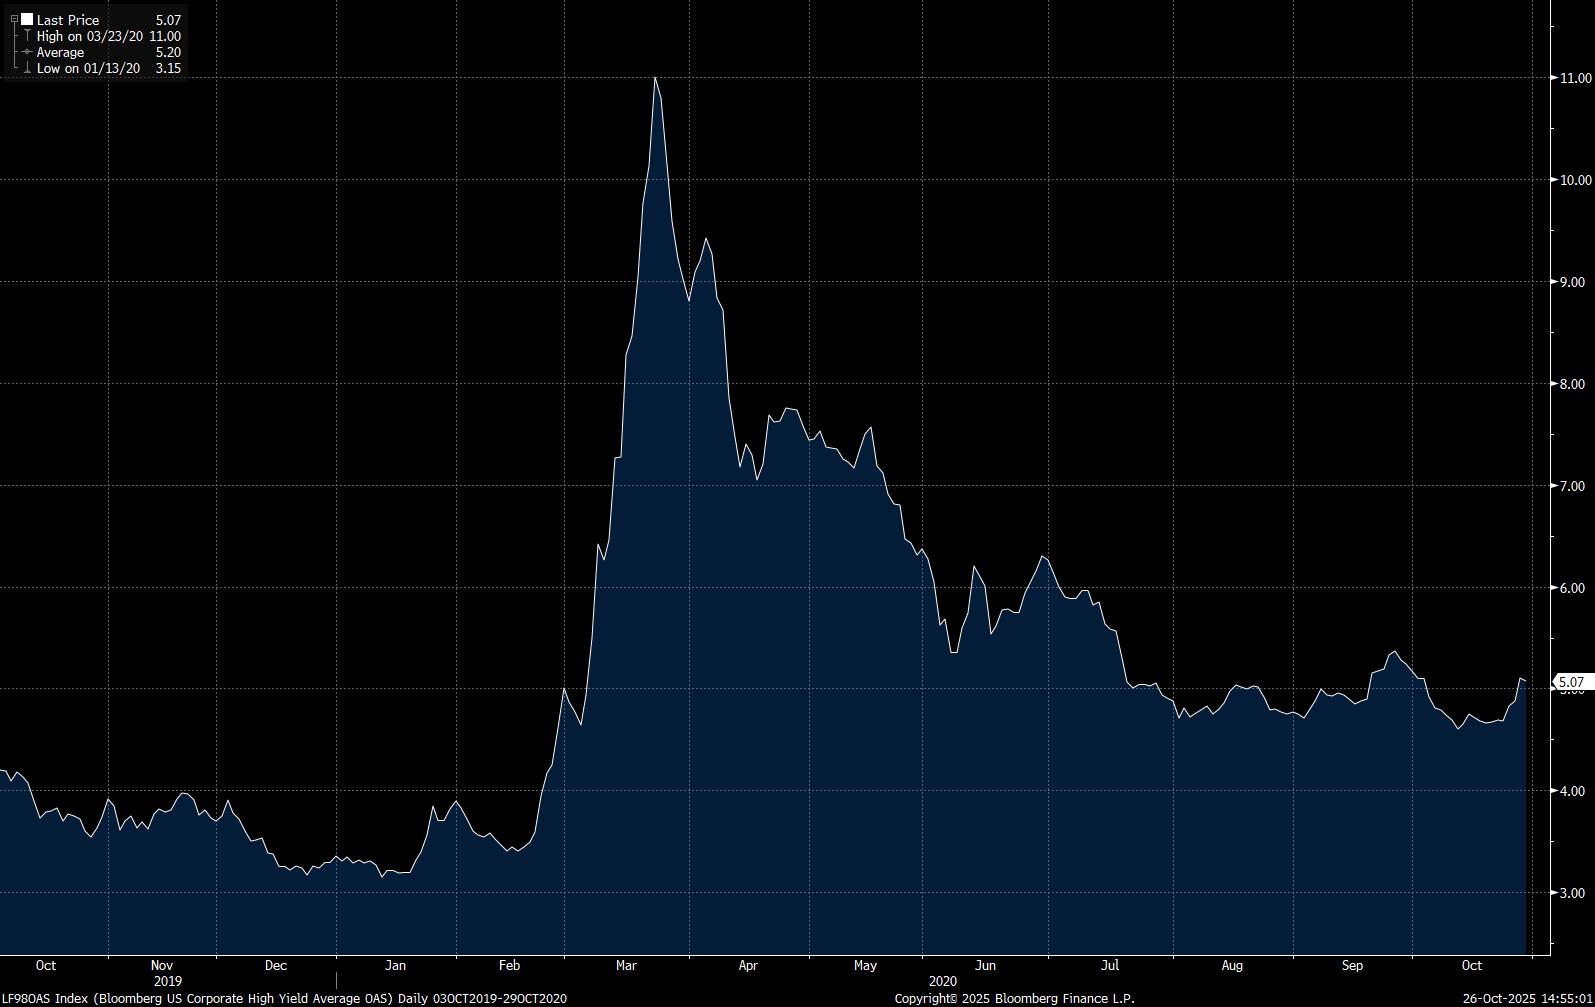
The psychological effect was immediate: spreads tightened sharply, issuance reopened, and companies raced to term out debt at record size. It was one of the clearest demonstrations in history that policy backstops can override market panic and re-anchor risk pricing almost overnight.
Bringing It Around to 2025
We laid out the current dynamics of Big Tech’s entrance to the credit world, and after reading the above primer, you have a good sense of how credit markets work. Now, let’s take a further look at current market dynamics.
Equity markets have ridden the AI wave to record highs, but bond investors are taking a more circumspect view, less concerned about betting on AI’s future or Big Tech’s success, and instead focused on downside risks.
The deluge of tech issuance hitting the corporate bond market is not only headline-grabbing but also a stress test for how credit absorbs unprecedented capex cycles. The sheer scale of data-centre financing risks creating supply indigestion, particularly in dollars, but increasingly in euros as US tech issuers push into underpenetrated markets. The lure of lower yields in the euro area is hard for US companies to resist, and given current rate expectations on the two sides of the pond, it’s expected that the inward flow of reverse Yankees (bonds issued by US firms in a foreign currency) will continue.
Tech issuers have also shown themselves to be less price-sensitive, given the strategic importance of the AI buildout. This is a new dynamic for credit markets and one that will likely reprice credit far beyond the tech complex.
At the lower end of the quality spectrum, the picture is trickier. While originally limited to investment-grade infrastructure and real estate financing, high-yield issuance is also spilling into the junk debt markets. Cipher Mining and TeraWulf (crypto mining companies that are pivoting towards the AI expansion) have recently sold high-yield debt to fund data centre expansion. Applied Digital said it plans to sell $2.35 billion of five-year green senior secured notes to fund additional computing capacity.
If the market digests too much speculative supply too quickly, spreads on this cohort can widen sharply and force other issuers to match concessions. Big Tech hyperscalers are one thing, but a glut of supply of lower-quality names in the AI space might be too much for markets to stomach.
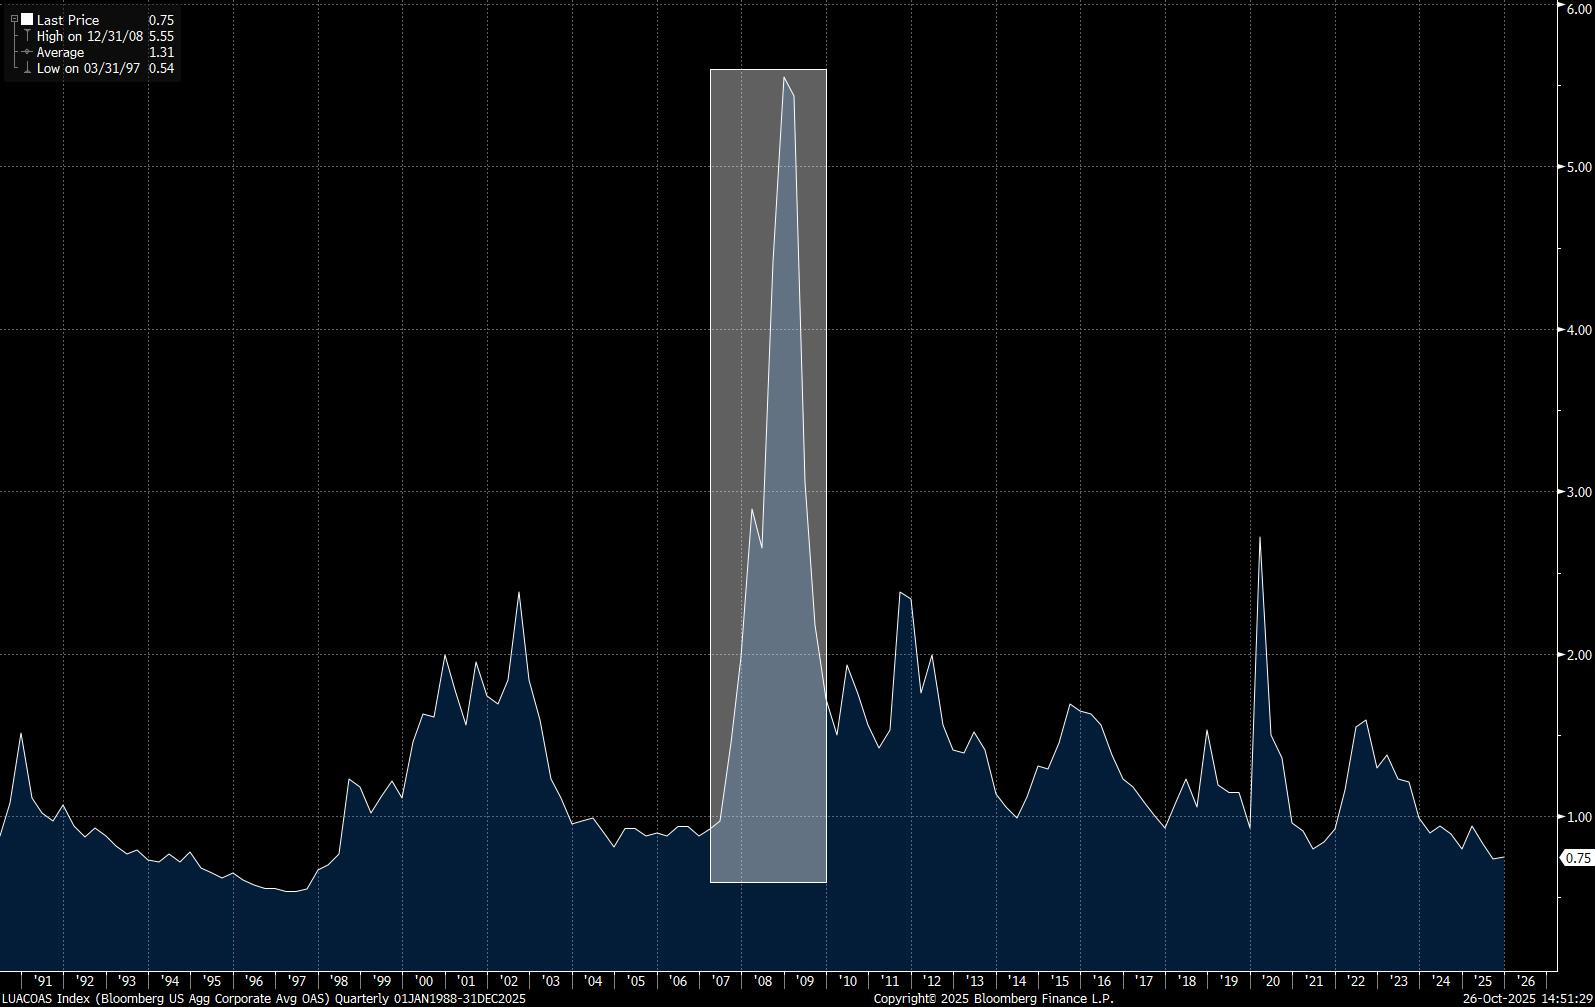
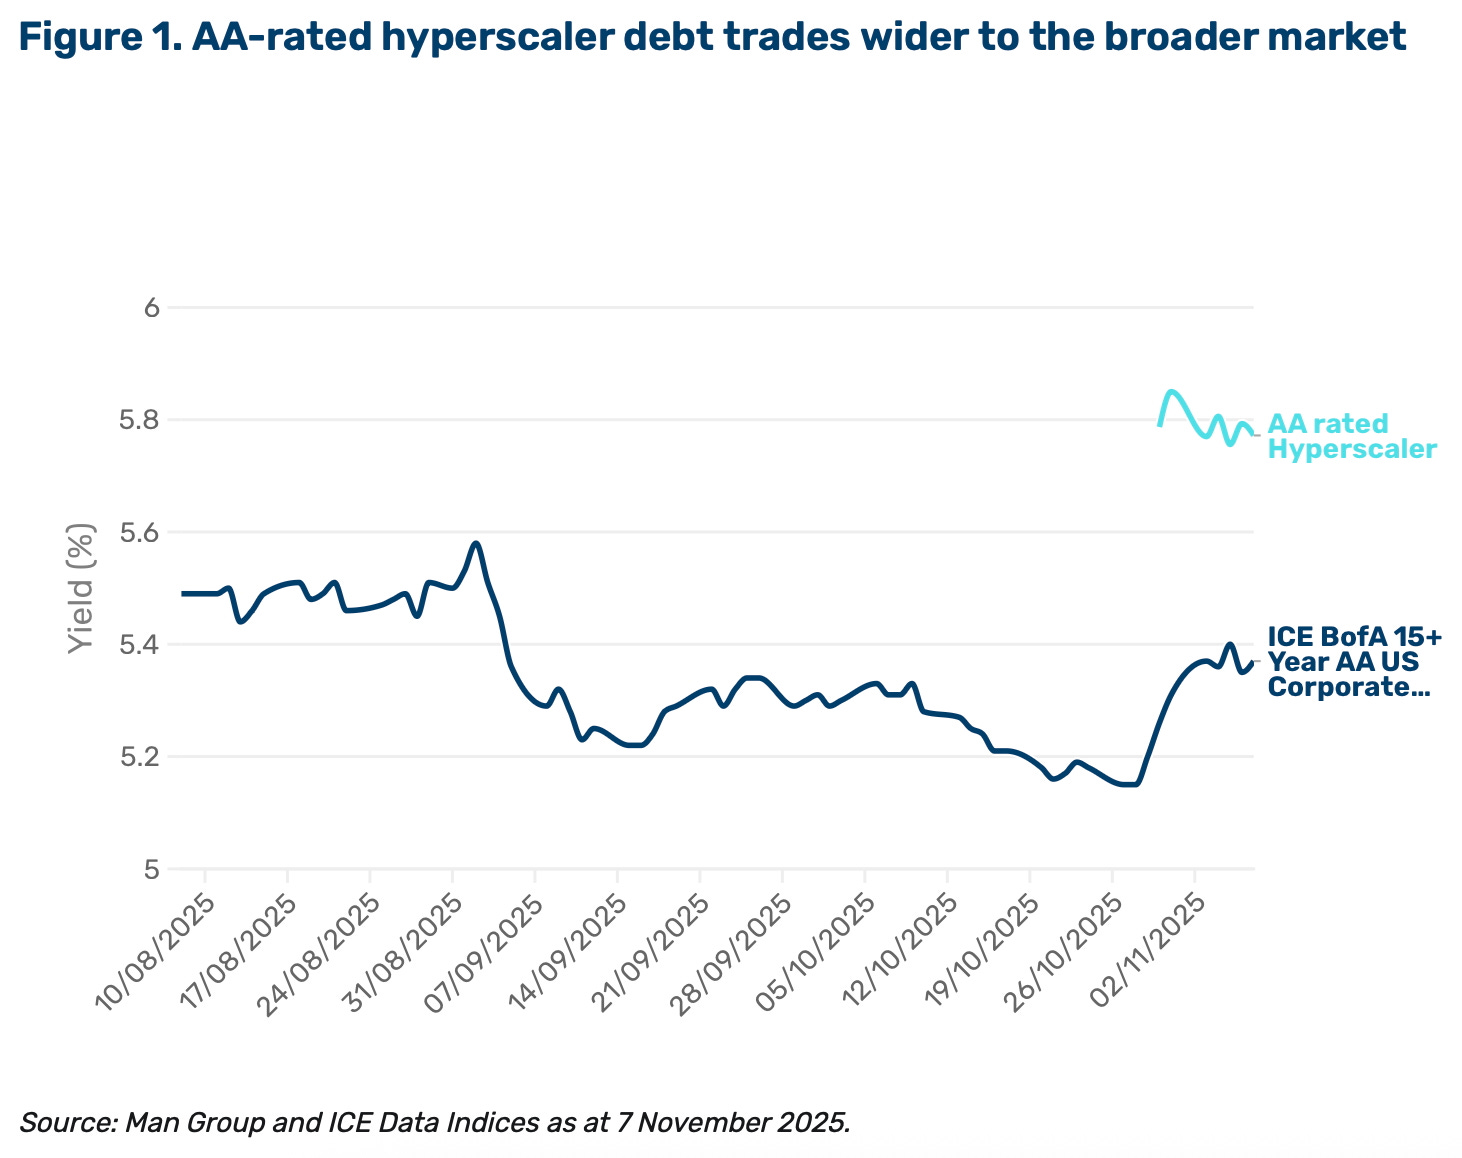
Meanwhile, core investment-grade spreads have remained surprisingly well-anchored this year, cushioned by heavy inflows hunting for yield. For Europe, Big Tech’s expanding presence remains a net positive, while investors remain underweight to high-quality US tech credit, and euro demand can comfortably absorb more paper as long as credit profiles remain intact. But the forward picture is shifting. IG spreads may drift toward a 100–110bp “base range” by 2026 (see chart below of recent trend higher) as issuance hits new records and the market re-prices supply pressure, duration risk, and a more uncertain profitability path for AI capex.
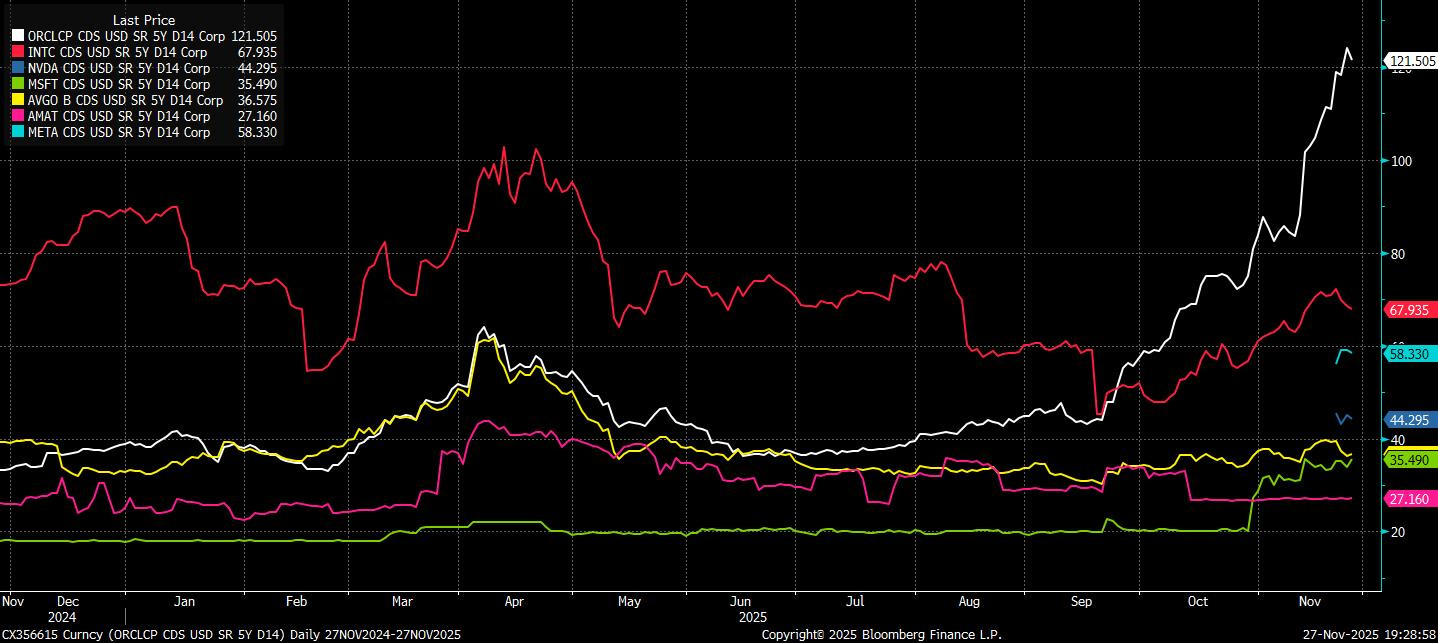
Refinancing risk and macro market destabilisation are also acute risks. If markets stay calm and yields drift lower, refinancing debt is straightforward. But if the macro environment gets shaky (slower growth, higher inflation, policy uncertainty, an equity selloff, or just a shift in risk appetite), the cost of issuing new bonds spikes and investor demand becomes more selective. Lenders, wary of the risks that surround the AI boom, are hedging their exposure via single-name CDS, betting selectively against future monetisation.
This is the backdrop into which every corporate issuer now walks. Lower-quality firms with concentrated revenue bases or data-centre timelines will find required yields creeping higher. Higher-quality tech issuers may still enjoy outsized demand, but this introduces new distortions for the rest of the market. The centre of gravity in corporate credit is shifting toward AI-funded capex cycles, and no sector remains insulated.
Ultimately, corporate credit is a forward-looking market. Successful participation requires understanding not only what a bond pays, but why it pays that spread, how its risks evolve across time, and what happens when liquidity dries up. In that sense, corporate bonds offer more than income. They offer a lens into how the financial system prices risk itself.
You can read more of our Global Primer Series here.
We hope you enjoyed the insights on corporate bonds. If so, please like and repost/share this article to show your support. As always, comments and opinions to keep the conversation going are welcome in the comments.
AP
“Big Tech” includes Alphabet, Amazon.com, Meta Platforms, Microsoft, and Oracle. Issuance through Nov. 20.
Amazing Article. Thx AP
Amazing write-up, appreciate it! Corp Bonds seem to be in for an "interesting time", I somehow have a feeling they might be the next linchpin for volatility episodes due to the overshooting CapEx in "AI" and subsequent disappointments in ROI.
The US Dollar supply available for lending came up in multiple notes and comments, too.